Archive for Mai, 2023
Mittwoch, Mai 3rd, 2023
First making a SSH connection
root@RA-VMWARE8-01:~] cat /dev/urandom | md5sum
and an additional SSH connection
root@RA-VMWARE8-01:~] esxtop
10:59:59am up 23 min, 609 worlds, 1 VMs, 2 vCPUs; CPU load average: 0.11, 0.04, 0.06
PCPU USED(%): 3.3 103 7.0 2.0 NUMA: 28 AVG: 28
PCPU UTIL(%): 3.4 100 7.3 2.1 NUMA: 28 AVG: 28
ID GID NAME NWLD %USED %RUN %SYS %WAIT %VMWAIT %RDY %I
20274 20274 cat.264999 1 99.28 99.92 0.00 0.00 – 0.02 0
20256 20256 esxtop.264996 1 4.53 4.48 0.00 95.46 – 0.00 0
20283 20283 md5sum.265000 1 2.95 2.99 0.00 96.69 – 0.26 0
18312 18312 VA-W2k22s-01d 10 2.36 2.34 0.05 996.79 0.12 0.30 197
Posted in Administration, VMware vSphere 8 | No Comments »
Mittwoch, Mai 3rd, 2023
 VMware vSphere Hypervisor (ESXi 8.x) – how to test CPU Max Turbo Boost Frequency
root@RA-VMWARE8-01:~] esxtop
4:24:01pm up 37 min, 611 worlds, 1 VMs, 2 vCPUs; CPU load average: 0.39, 0.40, 0.54
PCPU USED(%): 38 8.2 109 11 NUMA: 41 AVG: 41
PCPU UTIL(%): 23 5.3 69 7.1 NUMA: 26 AVG: 26
ID GID NAME NWLD %USED %RUN %SYS %WAIT %VMWAIT %RDY
22209 22209 VA-W2k22s-01d 10 157.26 97.77 0.96 901.77 0.05 0.45 1
25809 25809 esxtop.265656 1 4.61 3.12 0.00 96.90 – 0.00
16358 16358 hostd.264379 27 2.57 1.61 0.00 2699.48 – 0.07
1 1 system 292 1.46 297.08 0.00 28798.48 – 105.08
22002 22002 dcui.265114 4 0.20 0.12 0.00 399.70 – 0.16
19 19 userworld 4 0.09 0.06 0.00 399.95 – 0.00
…
press „p“ to change to the processor power management tab
add the %A/MPERF field to the view (press „f“, then „f“ again“, then [return]
observe the values in this column. 100 means that the core is running on nominal frequency, higher values means it runs with higher frequency.
Current Field order: ABCDeF
* A: PCPU = PCPU Id
* B: CPU Usage = CPU Usage time: %USED and %UTIL
* C: %CState = Percentage of time spent in a C-State
* D: %PState = Percentage of time spent in a P-State
E: %TState = Percentage of time spent in a T-State
* F: %Aperf/Mperf = Percentage of aperf to mperf ratio
Toggle fields with a-f, any other key to return:
4:21:36pm up 34 min, 611 worlds, 1 VMs, 2 vCPUs; CPU load average: 0.41, 0.46, 0.57
Power Usage: N/A , Power Cap: N/A
PSTATE MHZ: 1501 1500 1400 1300 1200 1100 1000 900 800
CPU %USED %UTIL %C0 %C1 %C2 %C3 %P0 %P1 %P2 %P3 %P4 %P5 %P6 %P7 %P8 %A/MPERF
0 14.3 9.2 9 91 0 0 100 0 0 0 0 0 0 0 0 159.8
1 140.5 87.7 88 12 0 0 100 0 0 0 0 0 0 0 0 160.0
2 6.6 4.1 4 96 0 0 100 0 0 0 0 0 0 0 0 159.7
3 2.1 1.4 1 99 0 0 100 0 0 0 0 0 0 0 0 159.8
4:25:16pm up 38 min, 608 worlds, 1 VMs, 2 vCPUs; CPU load average: 0.16, 0.35, 0.50
Power Usage: N/A , Power Cap: N/A
PSTATE MHZ: 1501 1500 1400 1300 1200 1100 1000 900 800
CPU %USED %UTIL %C0 %C1 %C2 %C3 %P0 %P1 %P2 %P3 %P4 %P5 %P6 %P7 %P8 %A/MPERF
0 0.5 0.5 0 100 0 0 100 0 0 0 0 0 0 0 0 110.9
1 0.7 0.7 1 99 0 0 100 0 0 0 0 0 0 0 0 118.7
2 4.9 3.2 3 97 0 0 100 0 0 0 0 0 0 0 0 154.2
3 1.1 1.0 1 99 0 0 100 0 0 0 0 0 0 0 0 116.4
9:07:24am up 21 min, 610 worlds, 1 VMs, 2 vCPUs; CPU load average: 0.02, 0.13, 0.10
Power Usage: N/A , Power Cap: N/A
PSTATE MHZ:
CPU %USED %UTIL %C0 %C1 %C2 %C3 %A/MPERF
0 0.7 0.9 1 99 0 0 87.4
1 6.8 7.1 7 93 0 0 98.5
2 5.2 5.5 7 93 0 0 98.9
3 3.2 4.0 6 94 0 0 99.0
3:35:52pm up 1:42, 636 worlds, 0 VMs, 0 vCPUs; CPU load average: 0.02, 0.01, 0.01
Power Usage: N/A , Power Cap: N/A
PSTATE MHZ: 1501 1500 1400 1300 1200 1100 1000 900 800
CPU %USED %UTIL %C0 %C1 %C2 %C3 %P0 %P1 %P2 %P3 %P4 %P5 %P6 %P7 %P8 %T0 %T1 %T2 %T3 %T4 %T5 %T6 %T7 %A/MPERF
0 4.8 3.2 3 97 0 0 100 0 0 0 0 0 0 0 0 100 0 0 0 0 0 0 0 149.7
1 0.4 0.6 1 99 0 0 100 0 0 0 0 0 0 0 0 100 0 0 0 0 0 0 0 83.3
2 0.3 0.4 0 100 0 0 100 0 0 0 0 0 0 0 0 100 0 0 0 0 0 0 0 98.9
3 0.2 0.2 0 100 0 0 100 0 0 0 0 0 0 0 0 100 0 0 0 0 0 0 0 110.4
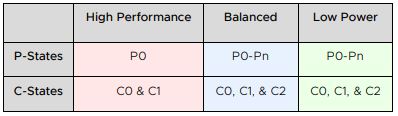
C-State Selection – the available C-States are shown as different columns. The available C-states are numbered consecutively without gaps (C2, in this case, corresponds to Intel’s C6 deep C-state). Each row shows the percentage of time the logical CPU votes to stay in that particular C-State
P-State Selection – the screenshot shows 16 different P-States P0 to P7 P0 has the highest clock frequency (1.501 GHz) and P7 has the lowest clock frequency (0.80 GHz). Each logical core on the physical core can vote for a particular P-State (frequency) but the P-State assignment happens at the physical core level. Thus the lower P-State vote between the two requests is selected. On the other hand if a processor has a socket-level P-State granularity, then the chosen operating P-State would be the lowest vote across all cores on the socket
%Aperf/Mperf – this column shows the ratio of Aperf to Mperf which indicates the actual frequency at which the core is running. A value of 100 means the core is running at nominal/base frequency anything higher indicates running in turbo and anything lower suggests the core is running at lower frequencies. Note that the %Aperf/Mperf counter is updated only when the core is in the running state (C0-state) so the counter value is not valid when the core spends time in C1 or C2 idle sleep states
Posted in Administration, VMware vSphere 8 | No Comments »
Dienstag, Mai 2nd, 2023
root@RA-VMWARE8-01:~] esxtop
7:18:50pm up 3:31, 608 worlds, 1 VMs, 2 vCPUs; CPU load average: 0.01, 0.01, 0.01
PCPU USED(%): 1.1 0.7 7.7 1.0 NUMA: 2.6 AVG: 2.6
PCPU UTIL(%): 0.9 0.7 3.5 0.9 NUMA: 1.5 AVG: 1.5
ID GID NAME NWLD %USED %RUN %SYS %WAIT %VMWAIT %RDY %IDLE %OVRLP
33828 33828 esxtop.266729 1 6.93 2.84 0.00 97.15 – 0.00 0.00 0.00
22209 22209 VA-W2k22s-01d 10 1.61 1.11 0.02 998.73 4.31 0.11 194.54 0.01
1 1 system 289 1.27 395.64 0.00 28501.51 – 5.75 0.00 0.20
16358 16358 hostd.264379 27 0.21 0.14 0.00 2699.64 – 0.05 0.00 0.00
19 19 userworld 4 0.10 0.07 0.00 399.97 – 0.00 0.00 0.00
22002 22002 dcui.265114 4 0.06 0.06 0.00 399.79 – 0.13 0.00 0.00
…
press „m“ to change to the memory tab
7:40:25pm up 3:53, 608 worlds, 1 VMs, 2 vCPUs; MEM overcommit avg: 0.00, 0.00, 0.00
PMEM /MB: 16153 total: 199 vmk,5885 other, 10067 free
VMKMEM/MB: 16074 managed: 649 minfree, 4653 rsvd, 11420 ursvd, high state
PSHARE/MB: 41 shared, 39 common: 2 saving
SWAP /MB: 0 curr, 0 rclmtgt: 0.00 r/s, 0.00 w/s
ZIP /MB: 0 zipped, 0 saved
MEMCTL/MB: 0 curr, 0 target, 2661 max
GID NAME MEMSZ GRANT CNSM SZTGT TCHD TCHD_W SWCUR SWTGT SWR/s S
22209 VA-W2k22s-01d 4183.38 4131.59 4094.00 4160.32 198.59 7.58 0.00 0.00 0.00
16358 hostd.264379 113.71 77.02 82.20 89.90 16.76 11.57 0.00 0.00 0.00
18231 vpxa.264615 38.59 21.77 26.29 28.46 5.51 0.99 0.00 0.00 0.00
22002 dcui.265114 30.43 10.72 11.40 12.47 0.81 0.13 0.00 0.00 0.00
1081 vmsyslogd.26236 27.57 15.61 16.55 18.11 11.22 10.28 0.00 0.00 0.00
1270 vobd.262389 27.17 9.66 11.40 12.36 1.85 0.11 0.00 0.00 0.00
23478 hostd-probe.265 24.21 17.38 18.31 20.04 1.39 0.46 0.00 0.00 0.00
2672 kmxa.262695 22.61 12.40 13.85 15.09 3.93 2.48 0.00 0.00 0.00
1072 vmsyslogd.26236 21.85 13.09 13.57 14.88 13.17 12.69 0.00 0.00 0.00
34215 esxtop.266790 21.79 12.49 13.14 14.39 3.36 2.71 0.00 0.00 0.00
Posted in Administration, VMware vSphere 8 | No Comments »
Dienstag, Mai 2nd, 2023
root@RA-VMWARE8-01:~] esxtop
7:18:50pm up 3:31, 608 worlds, 1 VMs, 2 vCPUs; CPU load average: 0.01, 0.01, 0.01
PCPU USED(%): 1.1 0.7 7.7 1.0 NUMA: 2.6 AVG: 2.6
PCPU UTIL(%): 0.9 0.7 3.5 0.9 NUMA: 1.5 AVG: 1.5
ID GID NAME NWLD %USED %RUN %SYS %WAIT %VMWAIT %RDY %IDLE %OVRLP
33828 33828 esxtop.266729 1 6.93 2.84 0.00 97.15 – 0.00 0.00 0.00
22209 22209 VA-W2k22s-01d 10 1.61 1.11 0.02 998.73 4.31 0.11 194.54 0.01
1 1 system 289 1.27 395.64 0.00 28501.51 – 5.75 0.00 0.20
16358 16358 hostd.264379 27 0.21 0.14 0.00 2699.64 – 0.05 0.00 0.00
19 19 userworld 4 0.10 0.07 0.00 399.97 – 0.00 0.00 0.00
22002 22002 dcui.265114 4 0.06 0.06 0.00 399.79 – 0.13 0.00 0.00
…
press „n“ to change to the network tab
7:25:21pm up 3:38, 608 worlds, 1 VMs, 2 vCPUs; CPU load average: 0.02, 0.02, 0.01
PORT-ID USED-BY TEAM-PNIC DNAME PKTTX/s MbTX/s PSZTX PKTRX/s MbR
67108866 Management n/a vSwitch0 0.00 0.00 0.00 0.00 0
67108867 vmk0 vusb0 vSwitch0 0.78 0.00 318.00 0.19 0
67108870 Shadow of vusb0 n/a vSwitch0 0.00 0.00 0.00 0.00 0
67108871 265174:VA-W2k22s-01d vusb0 vSwitch0 0.00 0.00 0.00 2.92 0
2214592517 vusb0 – vSwitch0 0.78 0.00 318.00 3.89 0
Posted in Administration, VMware vSphere 8 | No Comments »