Archive for Mai 3rd, 2023
Ostsee Warnemünde – online webcam
Mittwoch, Mai 3rd, 2023Proof Wood – Zaun aus Photovoltaik Module(n)
Mittwoch, Mai 3rd, 2023Google Chrome Version 113.0.5672.64 – steht zum Download bereit
Mittwoch, Mai 3rd, 2023Spain Malaga Andalucía Costa del Sol Airport (AGP) – online webcam
Mittwoch, Mai 3rd, 2023Microsoft 365 Visio – how to easily create swimlanes
Mittwoch, Mai 3rd, 2023Mittwoch, Mai 3rd, 2023
#Stromausfall in einem #Krankenhaus in #Mitte. Betroffen war auch die Rettungsstelle. Wir unterstützen die interne Verlegung von 8 Patienten in unbetroffene Klinikteile, verlegten 5 Patienten in andere Kliniken und hatten vorsorglich ein mobiles Notstromaggregat des #TD vor Ort. pic.twitter.com/3b9IDxuvyF
— Berliner Feuerwehr (@Berliner_Fw) May 3, 2023
Mittwoch, Mai 3rd, 2023
E-Mail Phishing: #ChatGPT und die Zukunft des Social Engineering
Vertrauen aufzubauen ist der Schlüssel zu erfolgreichem Social Engineering. KI hilft, authentische Mails und Gesprächsverläufe zu schreiben. Eine interessante Risikoanalyse.https://t.co/WyKXiARqUi
— FAST LTA (@fastlta) May 3, 2023
Oracle Redo Log Blocksize – 512 bytes or 4k blocksize for redo log (VMware 4k Sector support in the roadmap)
Mittwoch, Mai 3rd, 2023VMware Support statement for 512e and 4K Native drives for VMware vSphere and vSAN

The advantages of using Oracle Redo Log with 4k blocksize (default is 512 bytes with blocksize choices 512bytes, 1k and 4k) on VMware platforms and current challenges associated with that with roadmap guidance
Prof. Dr. Edmund Weitz – mit geordneten Paaren Tripel Quadrupeln und dem ganzen Zoo der Tupel
Mittwoch, Mai 3rd, 2023Bayerischer Ministerpräsident Dr. Markus Söder – Pressekonferenz mit der ZF Friedrichshafen AG und Wolfspeed am 03.05.2023
Mittwoch, Mai 3rd, 2023VMware vSphere Hypervisor (ESXi 8.x) – how to create a CPU spike with a bash command
Mittwoch, Mai 3rd, 2023First making a SSH connection
root@RA-VMWARE8-01:~] cat /dev/urandom | md5sum
and an additional SSH connection
root@RA-VMWARE8-01:~] esxtop
10:59:59am up 23 min, 609 worlds, 1 VMs, 2 vCPUs; CPU load average: 0.11, 0.04, 0.06
PCPU USED(%): 3.3 103 7.0 2.0 NUMA: 28 AVG: 28
PCPU UTIL(%): 3.4 100 7.3 2.1 NUMA: 28 AVG: 28
ID GID NAME NWLD %USED %RUN %SYS %WAIT %VMWAIT %RDY %I
20274 20274 cat.264999 1 99.28 99.92 0.00 0.00 – 0.02 0
20256 20256 esxtop.264996 1 4.53 4.48 0.00 95.46 – 0.00 0
20283 20283 md5sum.265000 1 2.95 2.99 0.00 96.69 – 0.26 0
18312 18312 VA-W2k22s-01d 10 2.36 2.34 0.05 996.79 0.12 0.30 197
Helios Klinikum Pforzheim – ein Toter bei Brand in der Notaufnahme
Mittwoch, Mai 3rd, 2023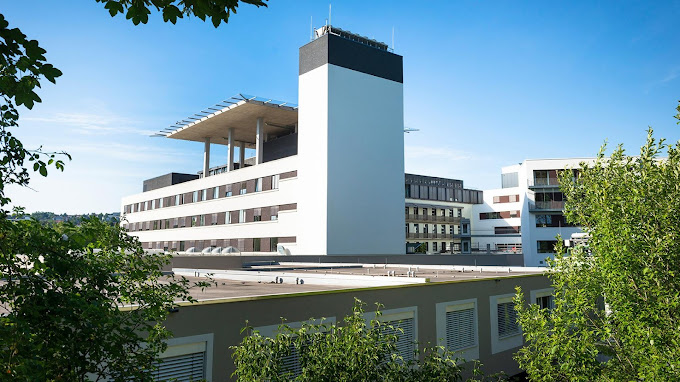
VMware vSphere Hypervisor (ESXi 8.x) – how to test CPU Max Turbo Boost Frequency
Mittwoch, Mai 3rd, 2023![]() VMware vSphere Hypervisor (ESXi 8.x) – how to test CPU Max Turbo Boost Frequency
VMware vSphere Hypervisor (ESXi 8.x) – how to test CPU Max Turbo Boost Frequency
root@RA-VMWARE8-01:~] esxtop
4:24:01pm up 37 min, 611 worlds, 1 VMs, 2 vCPUs; CPU load average: 0.39, 0.40, 0.54
PCPU USED(%): 38 8.2 109 11 NUMA: 41 AVG: 41
PCPU UTIL(%): 23 5.3 69 7.1 NUMA: 26 AVG: 26
ID GID NAME NWLD %USED %RUN %SYS %WAIT %VMWAIT %RDY
22209 22209 VA-W2k22s-01d 10 157.26 97.77 0.96 901.77 0.05 0.45 1
25809 25809 esxtop.265656 1 4.61 3.12 0.00 96.90 – 0.00
16358 16358 hostd.264379 27 2.57 1.61 0.00 2699.48 – 0.07
1 1 system 292 1.46 297.08 0.00 28798.48 – 105.08
22002 22002 dcui.265114 4 0.20 0.12 0.00 399.70 – 0.16
19 19 userworld 4 0.09 0.06 0.00 399.95 – 0.00
…
press „p“ to change to the processor power management tab
add the %A/MPERF field to the view (press „f“, then „f“ again“, then [return]
observe the values in this column. 100 means that the core is running on nominal frequency, higher values means it runs with higher frequency.
Current Field order: ABCDeF
* A: PCPU = PCPU Id
* B: CPU Usage = CPU Usage time: %USED and %UTIL
* C: %CState = Percentage of time spent in a C-State
* D: %PState = Percentage of time spent in a P-State
E: %TState = Percentage of time spent in a T-State
* F: %Aperf/Mperf = Percentage of aperf to mperf ratio
Toggle fields with a-f, any other key to return:
4:21:36pm up 34 min, 611 worlds, 1 VMs, 2 vCPUs; CPU load average: 0.41, 0.46, 0.57
Power Usage: N/A , Power Cap: N/A
PSTATE MHZ: 1501 1500 1400 1300 1200 1100 1000 900 800
CPU %USED %UTIL %C0 %C1 %C2 %C3 %P0 %P1 %P2 %P3 %P4 %P5 %P6 %P7 %P8 %A/MPERF
0 14.3 9.2 9 91 0 0 100 0 0 0 0 0 0 0 0 159.8
1 140.5 87.7 88 12 0 0 100 0 0 0 0 0 0 0 0 160.0
2 6.6 4.1 4 96 0 0 100 0 0 0 0 0 0 0 0 159.7
3 2.1 1.4 1 99 0 0 100 0 0 0 0 0 0 0 0 159.8
4:25:16pm up 38 min, 608 worlds, 1 VMs, 2 vCPUs; CPU load average: 0.16, 0.35, 0.50
Power Usage: N/A , Power Cap: N/A
PSTATE MHZ: 1501 1500 1400 1300 1200 1100 1000 900 800
CPU %USED %UTIL %C0 %C1 %C2 %C3 %P0 %P1 %P2 %P3 %P4 %P5 %P6 %P7 %P8 %A/MPERF
0 0.5 0.5 0 100 0 0 100 0 0 0 0 0 0 0 0 110.9
1 0.7 0.7 1 99 0 0 100 0 0 0 0 0 0 0 0 118.7
2 4.9 3.2 3 97 0 0 100 0 0 0 0 0 0 0 0 154.2
3 1.1 1.0 1 99 0 0 100 0 0 0 0 0 0 0 0 116.4
9:07:24am up 21 min, 610 worlds, 1 VMs, 2 vCPUs; CPU load average: 0.02, 0.13, 0.10
Power Usage: N/A , Power Cap: N/A
PSTATE MHZ:
CPU %USED %UTIL %C0 %C1 %C2 %C3 %A/MPERF
0 0.7 0.9 1 99 0 0 87.4
1 6.8 7.1 7 93 0 0 98.5
2 5.2 5.5 7 93 0 0 98.9
3 3.2 4.0 6 94 0 0 99.0
3:35:52pm up 1:42, 636 worlds, 0 VMs, 0 vCPUs; CPU load average: 0.02, 0.01, 0.01
Power Usage: N/A , Power Cap: N/A
PSTATE MHZ: 1501 1500 1400 1300 1200 1100 1000 900 800
CPU %USED %UTIL %C0 %C1 %C2 %C3 %P0 %P1 %P2 %P3 %P4 %P5 %P6 %P7 %P8 %T0 %T1 %T2 %T3 %T4 %T5 %T6 %T7 %A/MPERF
0 4.8 3.2 3 97 0 0 100 0 0 0 0 0 0 0 0 100 0 0 0 0 0 0 0 149.7
1 0.4 0.6 1 99 0 0 100 0 0 0 0 0 0 0 0 100 0 0 0 0 0 0 0 83.3
2 0.3 0.4 0 100 0 0 100 0 0 0 0 0 0 0 0 100 0 0 0 0 0 0 0 98.9
3 0.2 0.2 0 100 0 0 100 0 0 0 0 0 0 0 0 100 0 0 0 0 0 0 0 110.4
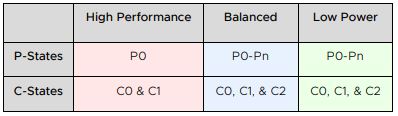
C-State Selection – the available C-States are shown as different columns. The available C-states are numbered consecutively without gaps (C2, in this case, corresponds to Intel’s C6 deep C-state). Each row shows the percentage of time the logical CPU votes to stay in that particular C-State
P-State Selection – the screenshot shows 16 different P-States P0 to P7 P0 has the highest clock frequency (1.501 GHz) and P7 has the lowest clock frequency (0.80 GHz). Each logical core on the physical core can vote for a particular P-State (frequency) but the P-State assignment happens at the physical core level. Thus the lower P-State vote between the two requests is selected. On the other hand if a processor has a socket-level P-State granularity, then the chosen operating P-State would be the lowest vote across all cores on the socket
%Aperf/Mperf – this column shows the ratio of Aperf to Mperf which indicates the actual frequency at which the core is running. A value of 100 means the core is running at nominal/base frequency anything higher indicates running in turbo and anything lower suggests the core is running at lower frequencies. Note that the %Aperf/Mperf counter is updated only when the core is in the running state (C0-state) so the counter value is not valid when the core spends time in C1 or C2 idle sleep states