Archive for the ‘Grafana’ Category
Grafana ‚Image Renderer‘ 3.7.0 – a backend plugin that handles rendering panels and dashboards to PNGs using a headless browser (Chromium)
Donnerstag, Mai 4th, 2023HomeLabNextGeneration – ein Grafana Dashboard für PV-Anlagen (PV) Anlagen
Donnerstag, April 6th, 2023Shelly & Tasmota – mit MQTT Node-Red InfluxDB in ein Grafana Dashboard
Freitag, August 19th, 2022Grafana 8.4 – new panels better query caching increased security accessibility features and more
Freitag, Februar 18th, 2022Proxmox Virtual Environment (VE) 7.0-13 – CheckMK Raw 2.0 plus Grafana ist gleich cooles Dashboards
Donnerstag, Oktober 21st, 2021Proxmox Virtual Environment (VE) 7.0-13 – Checkmk Raw 2.0 mit Docker installieren und Grafana Monitoring nutzen
Samstag, Oktober 16th, 2021Grafana Enterprise Logs 1.1 – label based access control (LBAC)
Donnerstag, August 5th, 2021Grafana 8.0.0 – release notes
Donnerstag, Juni 10th, 2021![]() Grafana 8.0.0 – release notes
Grafana 8.0.0 – release notes
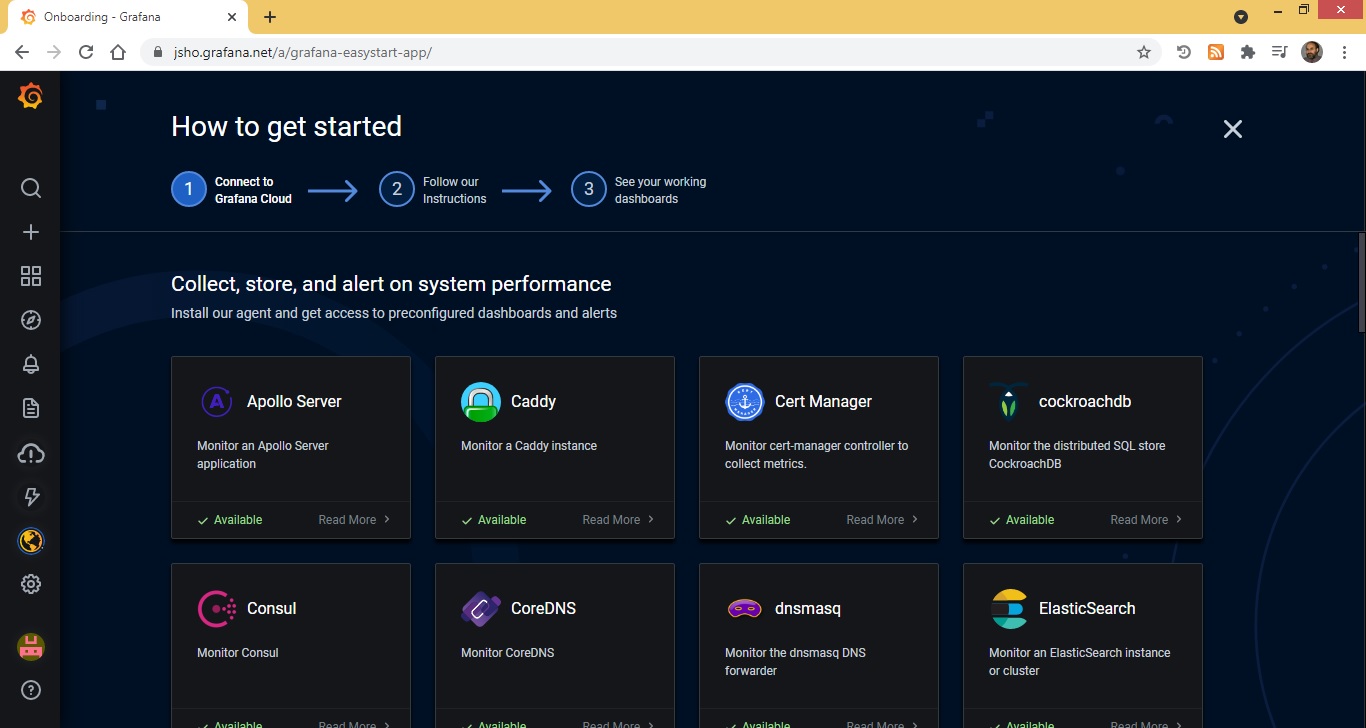
Grafana Cloud – your observability managed as a service
Samstag, März 27th, 2021![]() Grafana Cloud – is a composable observability platform integrating metrics and logs with Grafana
Grafana Cloud – is a composable observability platform integrating metrics and logs with Grafana
Grafana 7.4.0 – release notes
Mittwoch, Februar 10th, 2021![]() Grafana 7.4.0 – release notes
Grafana 7.4.0 – release notes
Grafana Tempo – is an open source, easy-to-use and high-scale distributed tracing backend
Freitag, Februar 5th, 2021
Brainboxes Industrial Edge Controller BB-400 – powered by an industrialised Raspberry Pi
Dienstag, Januar 12th, 2021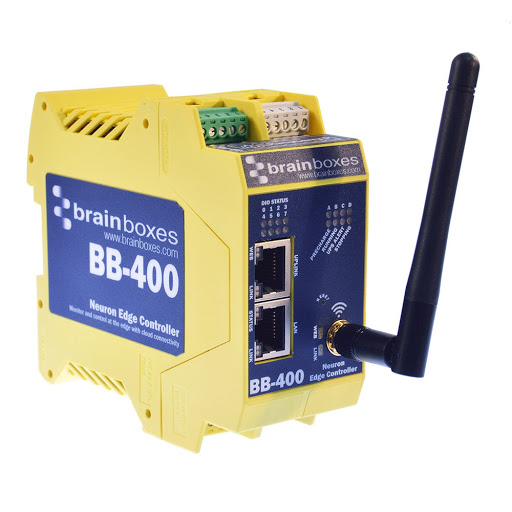
pfSense 2.5.x – Monitoring mit Telegraf & InfluxDB & Grafana
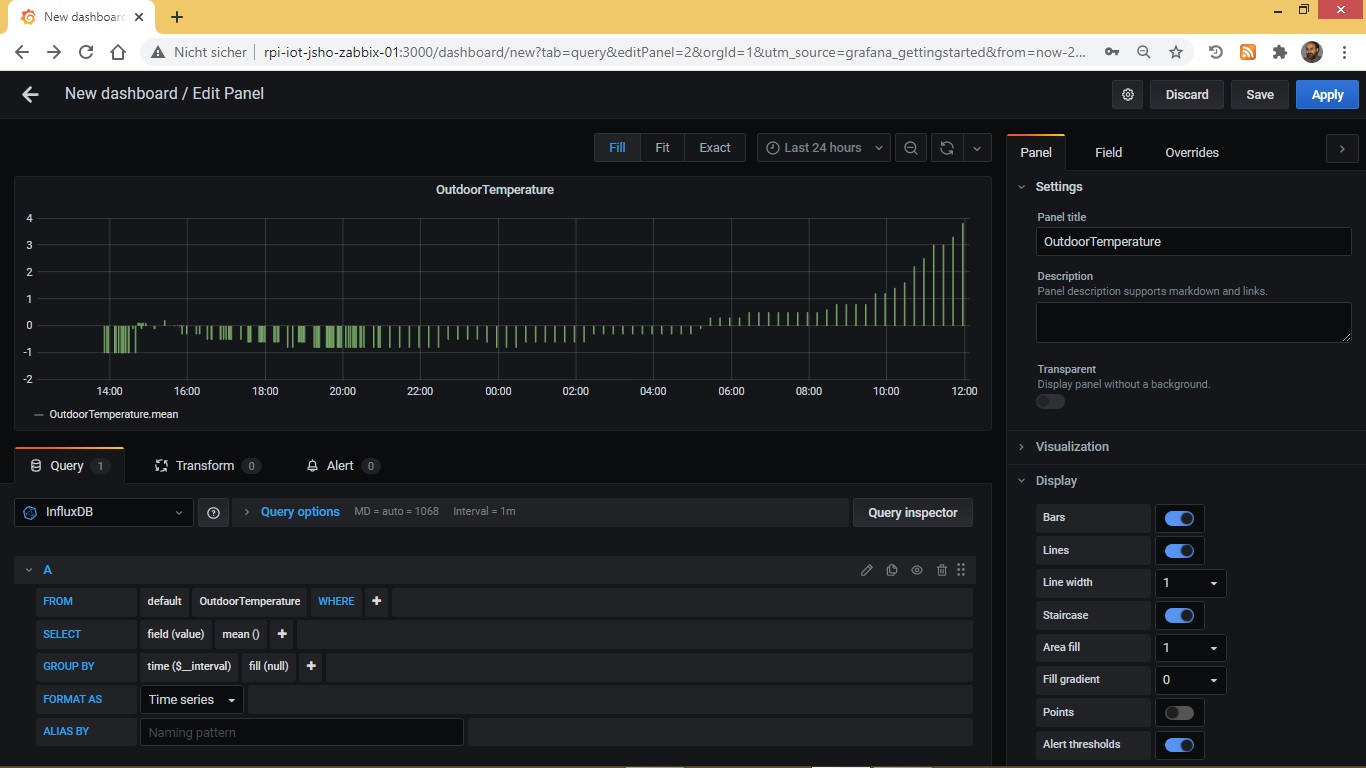
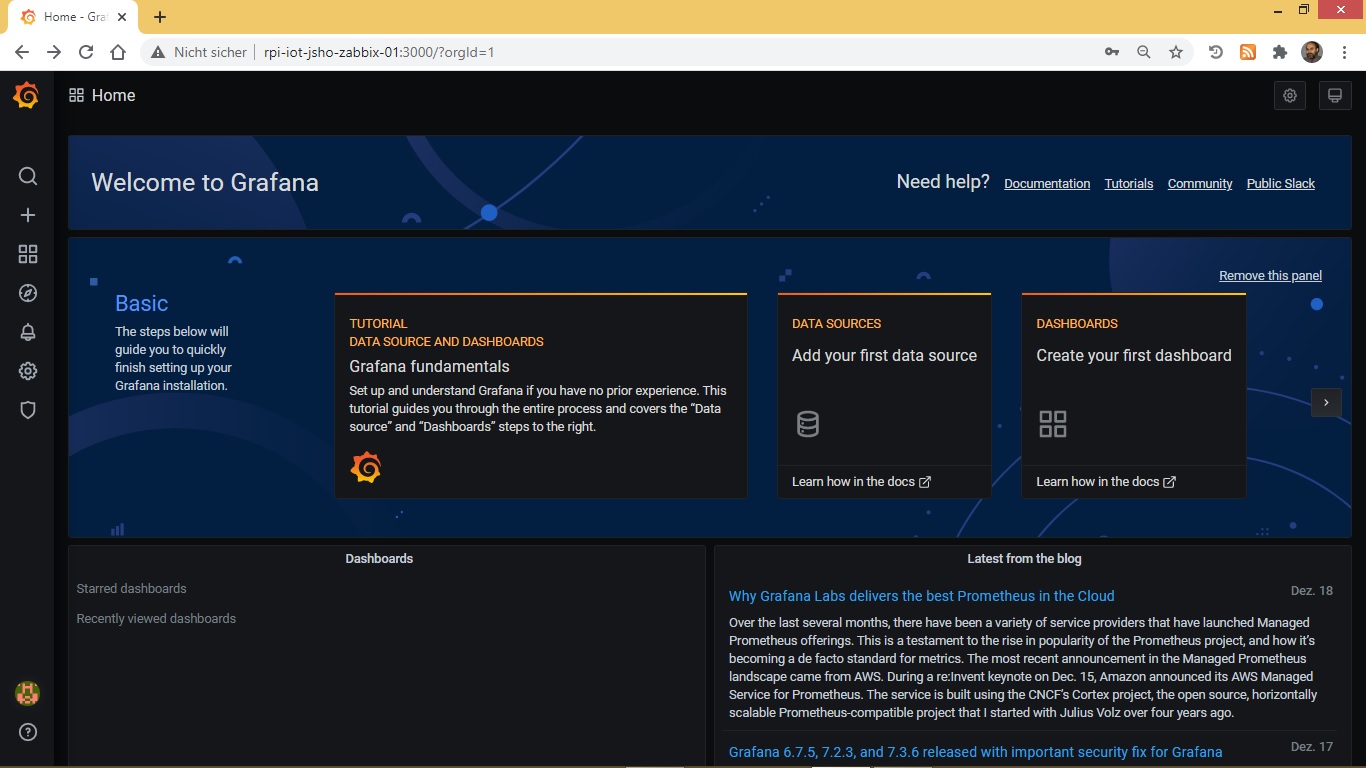
Dienstag, Dezember 22nd, 2020Grafana 7.3.6 – setting up on the Raspberry Pi
Montag, Dezember 21st, 2020![]() Grafana – complete installation of analysis tool and dashboard for Raspberry Pi
Grafana – complete installation of analysis tool and dashboard for Raspberry Pi
# wget -q -O – https://packages.grafana.com/gpg.key | apt-key add –
# echo „deb https://packages.grafana.com/oss/deb stable main“ | tee -a /etc/apt/sources.list.d/grafana.list
# apt-get install -y grafana
# /bin/systemctl enable grafana-server
# /bin/systemctl start grafana-server
the connection to InfluxDB …
the first dashboard …