![]() Grafana – complete installation of analysis tool and dashboard for Raspberry Pi
Grafana – complete installation of analysis tool and dashboard for Raspberry Pi
# wget -q -O – https://packages.grafana.com/gpg.key | apt-key add –
# echo „deb https://packages.grafana.com/oss/deb stable main“ | tee -a /etc/apt/sources.list.d/grafana.list
# apt-get install -y grafana
# /bin/systemctl enable grafana-server
# /bin/systemctl start grafana-server
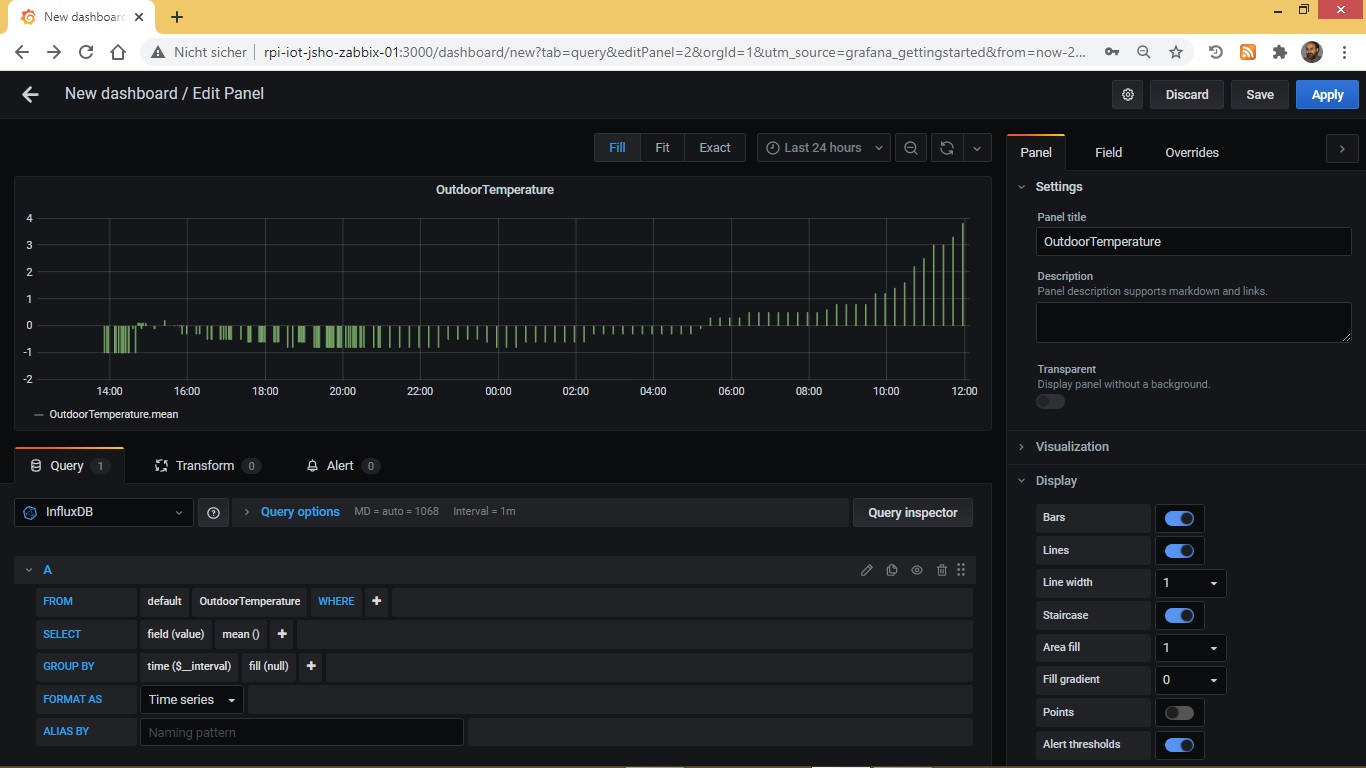
the connection to InfluxDB …
the first dashboard …