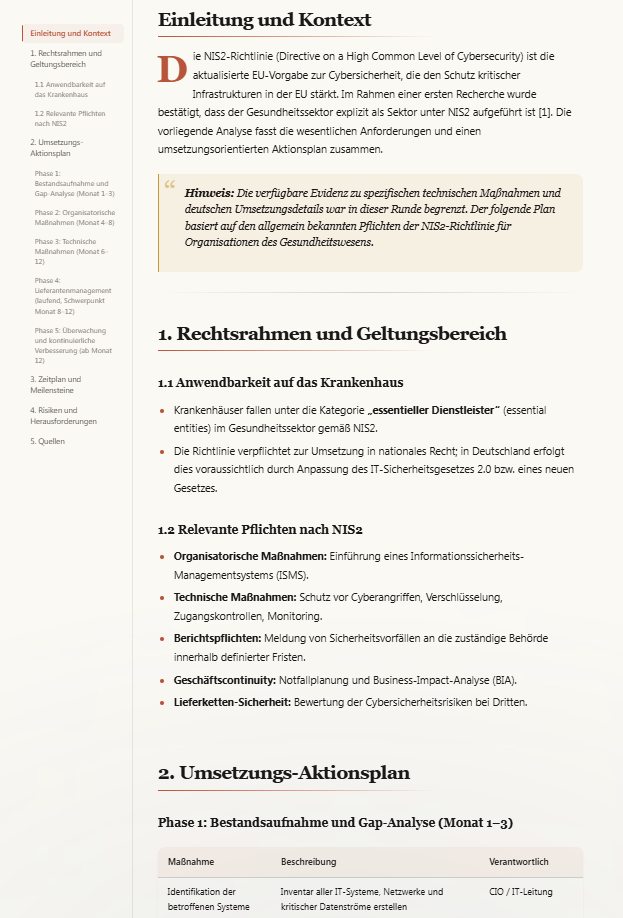
Odysseus AI – Aktionsplan zur Umsetzung der EU-NIS2-Richtlinie für ein deutsches Krankenhaus
August 2nd, 2026GEEKOM AI Mini PC IT13 Max – gebaut für einen lokalen KI Server der N8N Workflows Hermes Claude Code Kimi Ollama LM Studio und mehr verwaltet
August 2nd, 2026
Red Bull Romaniacs Hard Enduro Rally 2026 – Offroad Day #1
August 2nd, 2026Odysseus AI – Aktionsplan für das IT Team eines deutschen Krankenhauses zur EU-KI Verordnung (EU AI Act)
August 2nd, 2026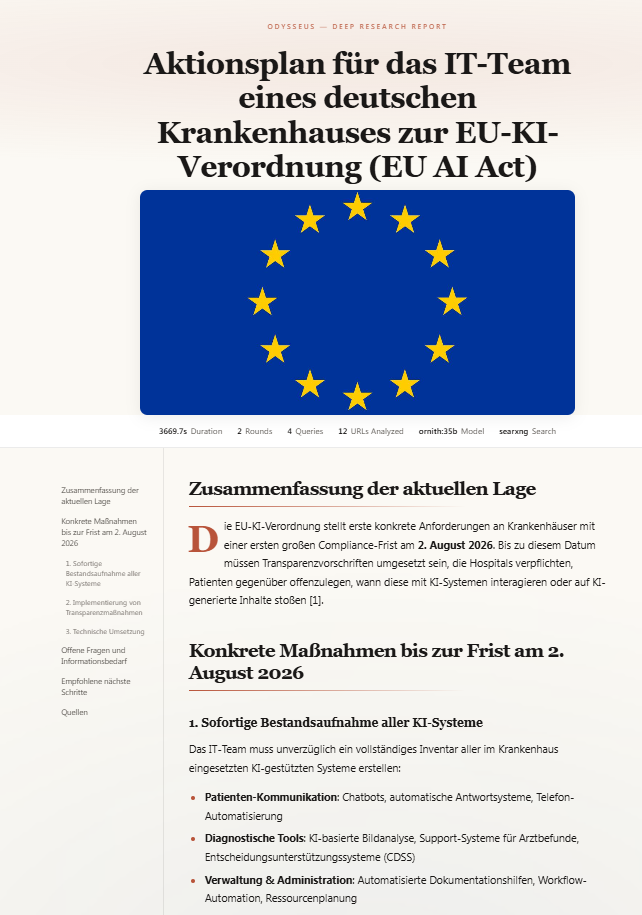
The EU Artificial Intelligence Act – ‚up-to-date‘ developments and analyses of the EU AI Act
August 2nd, 2026
Ferrari Luce – get to know the interiors and interfaces
August 2nd, 2026CDU Generalsekretärin Franziska Hoppermann – macht deutlich dass die CDU an der Abschaffung der abschlagsfreien Frührente ‚Rente mit 63‘ als Teil eines Reformpakets bei der Rente festhält
August 2nd, 2026Die drei ostdeutschen CDU Ministerpräsidenten Michael Kretschmer (Sachsen) Sven Schulze (Sachsen-Anhalt) und Mario Voigt (Thüringen) haben sich offen gegen die Empfehlung der Kommission gestellt
China Moonshot AI Kimi K3 LLM Model – nutzt über Alibaba die Kapazität von rund 20.000 NVIDIA Chips
August 1st, 2026Italy Golfo di Napoli – online webcam
August 1st, 2026Odysseus AI – ein komplettes Tutorial für eine private KI mit Ollama mit ‚ornith:35B‘ LLM
August 1st, 2026Nürburgring Langstrecken Serie 01.08.2026
August 1st, 2026
… does AI really help us
August 1st, 2026Wow, the situation in Spain looks crazy! pic.twitter.com/MrxMS4OCvG
— Elon Musk (@elonmusk) July 31, 2026
Odysseus AI – ‚Deep Research‘ timeout too short
August 1st, 2026