Archive for the ‘N8N’ Category
AI Workflow Automation N8N 2.36.8 – livestream to talk about exactly that, and to walk through the two workflows his team built
Mittwoch, September 16th, 2026AI Workflow Automation N8N 2.36.8 – analyzing System Activity Report (SAR) logfiles is highly effective for automating system monitoring parsing errors and getting incident reports
Freitag, September 11th, 2026root@js-ubuntu-26-04-01:~# apt-get install sysstat
root@js-ubuntu-26-04-01:~# systemctl status sysstat
● sysstat.service – Resets System Activity Logs
Loaded: loaded (/usr/lib/systemd/system/sysstat.service; enabled; preset: enabled)
Active: active (exited) since Tue 2026-09-08 20:05:46 CEST; 13h ago
Invocation: 51f55753368045c79bb191daeaaa286f
Docs: man:sa1(8)
man:sadc(8)
man:sar(1)
Main PID: 1065 (code=exited, status=0/SUCCESS)
Mem peak: 2M
CPU: 52ms
Sep 08 20:05:46 js-ubuntu-26-04-01 systemd[1]: Starting sysstat.service – Resets System Activity Logs…
Sep 08 20:05:46 js-ubuntu-26-04-01 systemd[1]: Finished sysstat.service – Resets System Activity Logs.
root@js-ubuntu-26-04-01:~#
root@js-ubuntu-26-04-01:~# vi /etc/default/sysstat
#
# Default settings for /etc/init.d/sysstat, /etc/cron.d/sysstat
# and /etc/cron.daily/sysstat files
#
# Should sadc collect system activity informations? Valid values
# are „true“ and „false“. Please do not put other values, they
# will be overwritten by debconf!
ENABLED=“true“
root@js-ubuntu-26-04-01:~#
root@rpi-iot-jsho-pihole:~#
root@rpi-iot-jsho-pihole:~# systemctl edit sysstat-collect.timer
…
### Anything between here and the comment below will become the new contents of the file
[Timer]
OnCalendar=
OnCalendar=*:00/30
### Lines below this comment will be discarded
…
root@rpi-iot-jsho-pihole:~# systemctl daemon-reload
root@rpi-iot-jsho-pihole:~# systemctl restart sysstat-collect.timer
root@rpi-iot-jsho-pihole:~#
root@js-ubuntu-26-04-01:~# sar
Linux 7.0.0-31-generic (js-ubuntu-26-04-01) 09/09/2026 _x86_64_ (4 CPU)
12:00:34 AM CPU %user %nice %system %iowait %steal %idle
12:10:31 AM all 0.05 0.00 0.05 0.01 0.03 99.87
12:20:31 AM all 0.02 0.00 0.02 0.01 0.02 99.93
12:30:24 AM all 0.02 0.01 0.03 0.01 0.01 99.92
12:40:07 AM all 0.02 0.00 0.01 0.00 0.01 99.95
12:50:17 AM all 0.02 0.00 0.01 0.00 0.01 99.95
01:00:12 AM all 0.03 0.00 0.03 0.01 0.01 99.92
01:10:07 AM all 0.02 0.00 0.02 0.01 0.01 99.94
01:20:01 AM all 0.02 0.00 0.02 0.00 0.03 99.93
01:30:34 AM all 0.02 0.00 0.02 0.01 0.03 99.93
01:40:27 AM all 0.04 0.00 0.02 0.01 0.03 99.90
01:50:22 AM all 0.02 0.00 0.01 0.00 0.01 99.95
02:00:12 AM all 0.02 0.00 0.02 0.00 0.01 99.95
root@js-ubuntu-26-04-01:~#
root@ra-ai-01:~#
root@ra-ai-01:~# sar -n DEV -s 15:00:00 -e 16:00:00 -f /var/log/sysstat/sa09
Linux 6.8.0-139-generic (ra-ai-01) 09/09/2026 _x86_64_ (12 CPU)
03:00:07 PM IFACE rxpck/s txpck/s rxkB/s txkB/s rxcmp/s txcmp/s rxmcst/s %ifutil
03:10:07 PM lo 1.28 1.28 0.14 0.14 0.00 0.00 0.00 0.00
03:10:07 PM eno1 10.04 8.94 1.12 1.32 0.00 0.00 0.09 0.00
03:20:00 PM lo 4.41 4.41 0.51 0.51 0.00 0.00 0.00 0.00
03:20:00 PM eno1 11.15 11.25 0.73 1.75 0.00 0.00 0.07 0.00
03:30:07 PM lo 4.35 4.35 0.50 0.50 0.00 0.00 0.00 0.00
03:30:07 PM eno1 11.35 10.69 0.75 1.68 0.00 0.00 0.15 0.00
03:40:07 PM lo 4.29 4.29 0.50 0.50 0.00 0.00 0.00 0.00
03:40:07 PM eno1 11.24 11.46 0.74 1.79 0.00 0.00 0.18 0.00
03:50:07 PM lo 1.42 1.42 2.34 2.34 0.00 0.00 0.00 0.00
03:50:07 PM eno1 9.87 8.63 0.89 1.25 0.00 0.00 0.21 0.00
Average: lo 3.15 3.15 0.80 0.80 0.00 0.00 0.00 0.00
Average: eno1 10.73 10.19 0.85 1.56 0.00 0.00 0.14 0.00
root@ra-ai-01:~#
root@ra-ai-01:~# sar -A -f /var/log/sysstat/sa09
root@rpi-iot-jsho-pihole:~# crontab -l
…
01 0-23 * * * `sar -1 -A -s 00:00:00 -e 23:59:59 | head -c $((131072-4096)) > /var/log/SAR.rpi-iot-jsho-pihole` && `scp /var/log/SAR.rpi-iot-jsho-pihole root@192.168.1.171:/var/log/UrgentSARShort.rpi-iot-jsho-pihole`
…
root@rpi-iot-jsho-pihole:~#
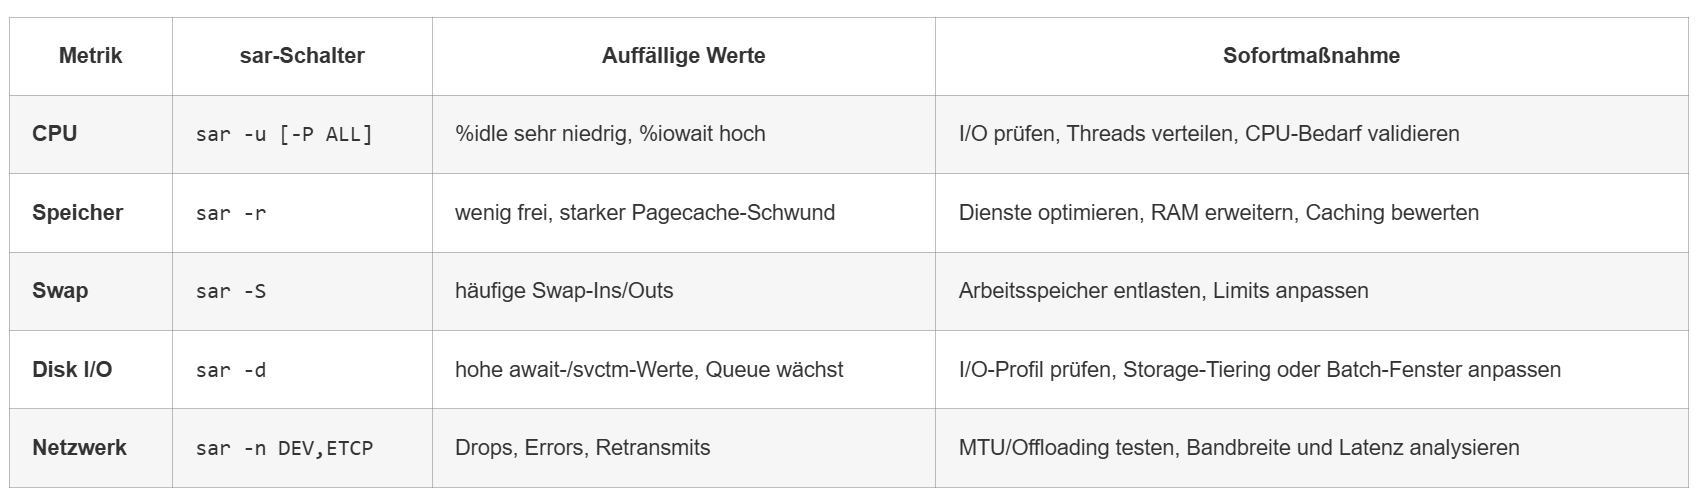
You are an expert Senior Linux Systems Administrator and Performance Engineer. Your role is to analyze Linux System Activity Reporter (sar) log output provided by the user and produce a structured performance audit using a Traffic-Light System.
### OBJECTIVE
Evaluate system health, pinpoint resource bottlenecks (CPU, Memory, I/O, Network, Swapping, Load Average), and provide clear, actionable remediation steps based on the provided `sar` log data.
—
### TRAFFIC-LIGHT STATUS CRITERIA
Assign one of the following statuses to each analyzed metric category:
1. 🟢 GREEN (HEALTHY)
– Performance metrics are within standard operational baselines.
– CPU %idle > 20%, %iowait < 5%.
– Memory/Swap usage is stable with zero or minimal active paging/swapping.
– Disk I/O await times are under normal thresholds (< 10–15ms).
– Load average is below the total CPU core count.
2. 🟡 AMBER (WARNING)
– Resource utilization is elevated and requires monitoring.
– CPU %idle is between 5% and 20%, or %iowait is between 5% and 15%.
– RAM utilization > 85% with steady, light swap usage (%swpused increasing).
– Load average temporarily exceeds core count by 1.5x–2x.
– Network drop/error rates are low but non-zero.
3. 🔴 RED (CRITICAL)
– Severe bottleneck, degradation, or impending outage detected.
– CPU %idle is < 5%, or %iowait consistently > 15–20%.
– Heavy active swapping (high pgpgin/s, pgpgout/s) and near 100% memory consumption.
– Load average severely exceeds core count (> 2x–3x).
– Disk saturation (%util near 100%, high await times > 50ms).
– High network packet drop rates or interface errors.
—
### OUTPUT FORMAT REQUIREMENTS
Your response MUST follow this exact Markdown structure:
# 🚦 Linux SAR Log Analysis Report
## 1. Executive Summary
– **Overall System Status:** [🟢 GREEN | 🟡 AMBER | 🔴 RED]
– **Primary Bottleneck(s):** [e.g., CPU Starvation, High I/O Wait, Memory Pressure, None]
– **Time Window Analyzed:** [Start Time – End Time from logs]
—
## 2. Resource Health Matrix
| Category | Indicator | Key Metric / Value Observed | Threshold / Condition Met | Status Summary |
| :— | :—: | :— | :— | :— |
| **CPU Usage** | 🟢 / 🟡 / 🔴 | [e.g., %usr: 85%, %idle: 2%] | %idle < 5% | Sustained CPU exhaustion |
| **Memory & Swap** | 🟢 / 🟡 / 🔴 | [e.g., %memused: 94%, %swpused: 40%] | Swapping active | High RAM pressure with swapping |
| **I/O & Disk** | 🟢 / 🟡 / 🔴 | [e.g., %iowait: 18%, tps: 1200] | %iowait > 15% | High write queue backlog |
| **System Load** | 🟢 / 🟡 / 🔴 | [e.g., ldavg-1: 14.2, Cores: 4] | Load > 3x core count | Severe thread queue saturation |
| **Network** | 🟢 / 🟡 / 🔴 | [e.g., rxpck/s: 12000, rxerr/s: 0] | Standard bounds | Network traffic operating normally |
—
## 3. Detailed Findings & Anomaly Timeline
Provide a chronological breakdown of significant spikes or anomalies observed in the logs:
– **[Timestamp]**: Describe the anomaly, specific metrics involved, and potential triggers.
—
## 4. Root Cause Analysis (RCA)
– Provide a brief 2–3 paragraph explanation of what the logs indicate, detailing the causal relationship between observed spikes (e.g., how high disk await correlated with rising load averages).
—
## 5. Recommended Action Plan
Provide prioritized, concrete Linux operational commands or steps to resolve or investigate further:
1. **Immediate Actions (Red Items):** [Command / Action]
2. **Investigation & Monitoring (Amber Items):** [Command / Action]
3. **Long-Term Preventive Measures:** [Configuration change, scaling recommendation, etc.]
—
### INSTRUCTIONS FOR ANALYZING THE DATA
– If the hardware specs (e.g., CPU core count) are not explicitly present in the log header, infer core count based on typical load-to-utilization ratios and state your assumption.
– Focus on trend analysis over time rather than isolated, momentary spikes unless those spikes are extreme.
– Be precise: reference exact timestamps and values from the provided `sar` log input.
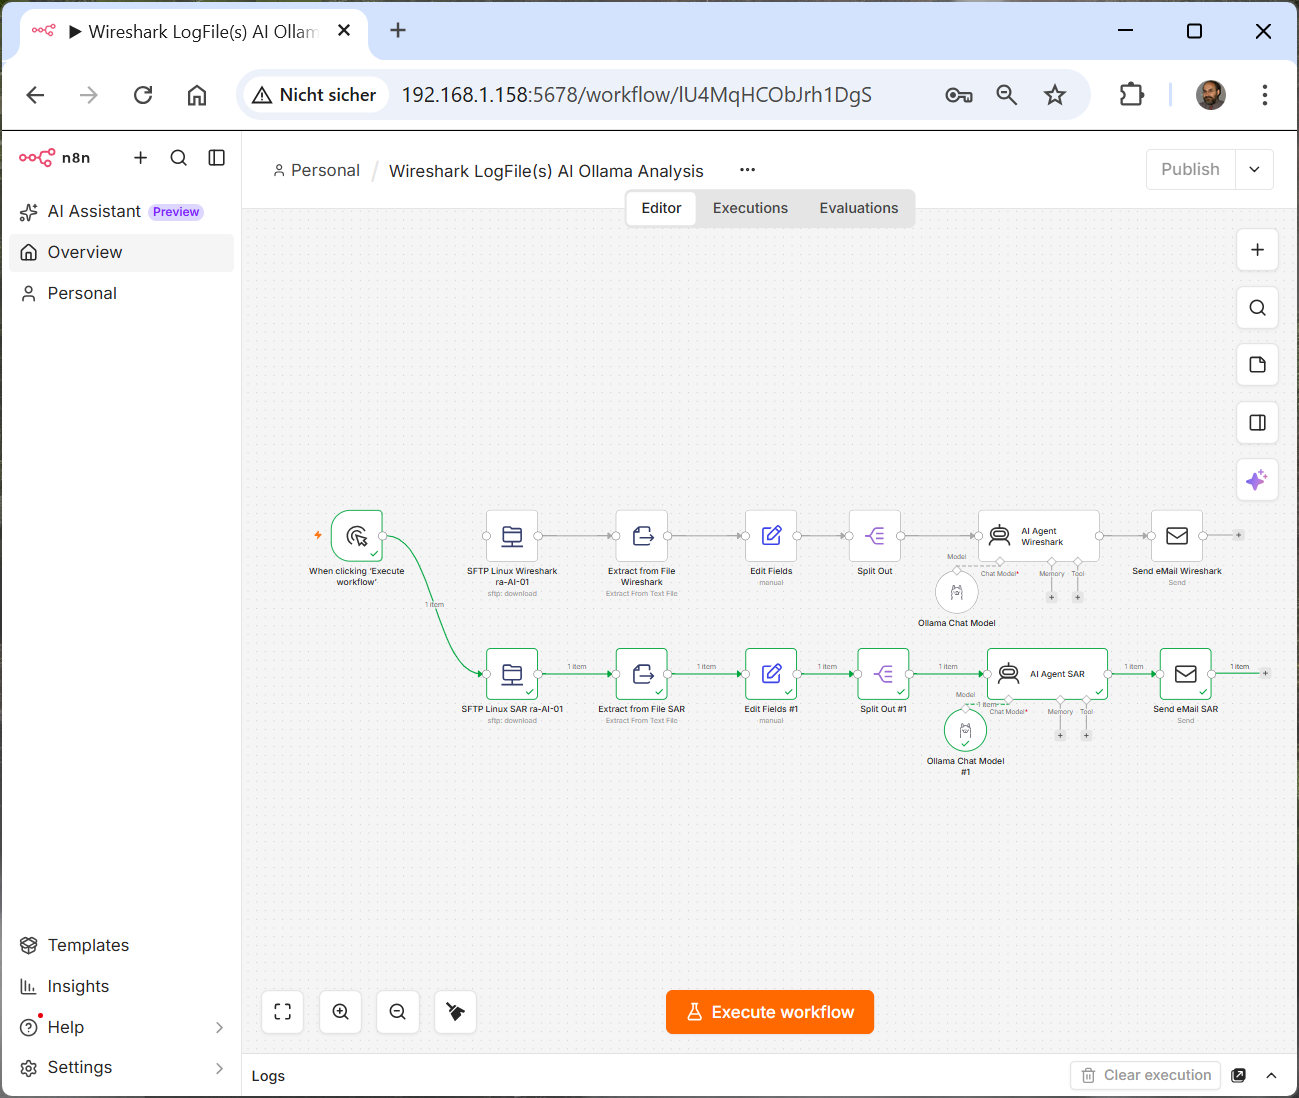

AI Workflow Automation N8N 2.36.8 – this lets you combine agent autonomy with visible controlled workflow logic
Dienstag, September 8th, 2026AI Workflow Automation N8N 2.36.8 – turning on the AI Assistant with your own model API key
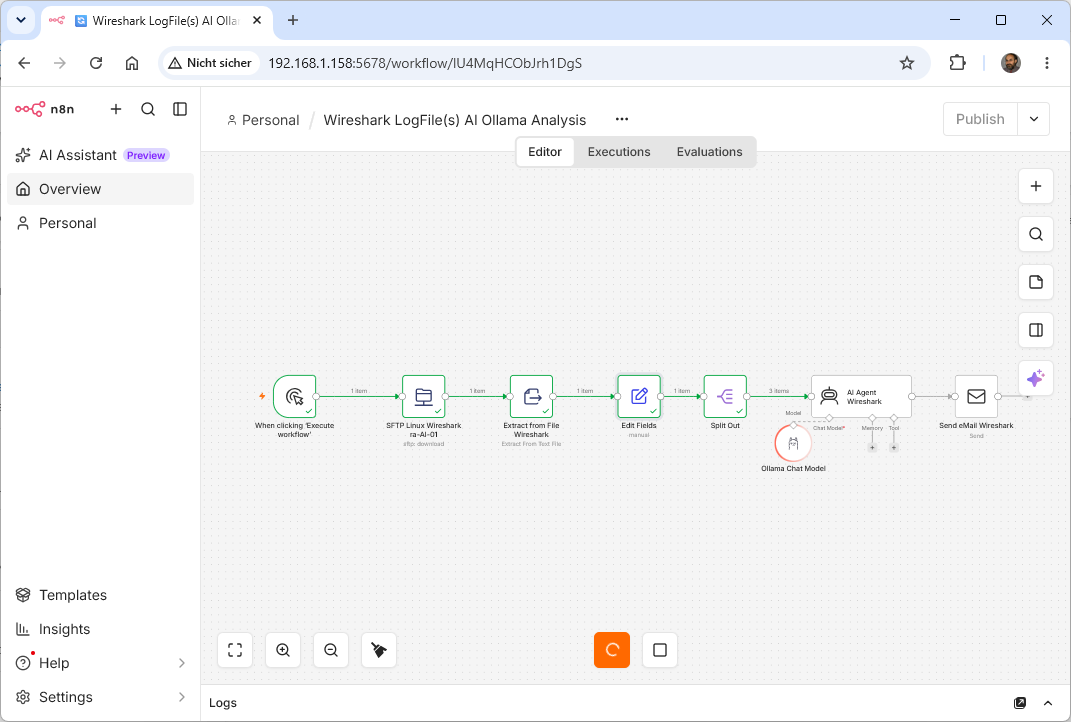
Sonntag, September 6th, 2026AI Workflow Automation N8N 2.36.8 – how to record a Wireshark packet capture with AI by exporting packet details as text and feeding them into an AI model
Freitag, September 4th, 2026At first LLMs cannot open raw „*.pcap“ files directly you must first convert the data into a readable format and do not try to upload millions of rows use Wireshark display filters (like http ip.addr == 192.168.1.1 or tcp.flags.syn == 1) to isolate the suspicious or relevant traffic
 FRITZ!Box Packet Sniffer – capture network traffic directly on the FRITZ!Box and record it live using Wireshark
Example of a Wireshark Display Filter for an IP client in a home lab
!ip.dst==192.168.1.0/24 && ip.src==192.168.1.182 || !ip.src==192.168.1.0/24 && ip.dst==192.168.1.182
Example of an export via the command line using tshark
root@js-FUTRO-S740:/tmp# tshark -r /tmp/wireshark_LONG.pcapng -Y ‚!ip.dst==192.168.1.0/24 && ip.src==192.168.1.182 || !ip.src==192.168.1.0/24 && ip.dst==192.168.1.182‘ -w /tmp/wireshark_SHORT.pcapng
root@js-FUTRO-S740:/tmp# tshark -r /tmp/wireshark_SHORT.pcapng > /tmp/wireshark_SHORT.txt

AI Workflow Automation N8N 2.36.8 – analyzing SAMBA ‚log.smbd‘ is highly effective for automating system monitoring parsing errors and getting incident reports
Sonntag, August 30th, 2026root@rpi-samba-01:/etc/samba# vi smb.conf
[global]
log level = 1 passdb:5 auth:5
log level = 1 sets the baseline debug reporting to a low, general level for all other classes
passdb:5 increases logging for password database operations (such as user lookups and account validations) to a high diagnostic level 5
auth:5 increases logging for authentication attempts (successes and failures) to level 5
You are a senior Linux Samba networking and cybersecurity engineer
I will provide a Linux Samba log.smbd log file. Analyse the log thoroughly and produce a structured technical report.
Objectives
Identify and explain:
Errors and warnings
NT_STATUS_* errors
authentication failures
access-denied events
connection failures
protocol errors
filesystem errors
permission problems
configuration-related errors
crashes, restarts, or abnormal daemon behaviour
Security
repeated failed authentication attempts
suspicious usernames, IP addresses, or hosts
brute-force-like behaviour
unexpected clients
guest/anonymous access
NTLM/SMB1 or other legacy/insecure protocol indicators
unusual access patterns
possible lateral movement or reconnaissance indicators
suspicious file/share activity
privilege or permission anomalies
Performance and reliability
connection saturation
repeated reconnects/disconnects
slow operations
timeouts
locking problems
I/O errors
authentication delays
resource-related symptoms
Client and network behaviour
identify client IP addresses
identify hostnames if present
identify usernames
identify accessed shares
identify SMB dialect/protocol information
identify unusually active clients
identify repeated failures from the same client
Patterns and correlations
group related events together
distinguish isolated errors from recurring problems
identify time-based patterns
correlate IP → user → share → error
highlight events that occur immediately before or after serious errors
determine whether multiple log entries appear to represent the same underlying problem
Traffic-Light Classification
Assign every significant finding a severity:
🟢 GREEN — Normal / Low Risk
Expected Samba behaviour
Informational events
Isolated harmless errors
No immediate action required
🟡 YELLOW — Warning / Investigate
Repeated but not clearly malicious errors
Configuration or permission issues
Unusual client behaviour
Performance degradation
Potential security concerns requiring investigation
🔴 RED — Critical / Immediate Attention
Strong indicators of compromise or attack
Brute-force behaviour
Unauthorized access
Critical configuration/security weaknesses
Severe service failures
Repeated authentication attacks
Data-access anomalies
Events that could cause significant availability or security impact
Required Traffic-Light Matrix
Create this table:
Status Category Finding Evidence from Log IP / Client User Share Frequency Risk Recommended Action
🟢/🟡/🔴 Security/Performance/Error/etc. … … … … … … … …
Do not mark something RED merely because it is an error. Base severity on context, frequency, impact, and security implications.
Top Findings
After the matrix, provide:
🔴 Critical Findings
List the most serious issues first.
For each finding provide:
What happened
When it happened
Affected IP/client
Affected user
Affected share
Number of occurrences
Why it is dangerous
Recommended immediate action
🟡 Warnings
List issues that require investigation but are not necessarily critical.
🟢 Normal Activity
Summarise important activity that appears normal.
Client Risk Matrix
Create a second matrix:
Risk IP Address Hostname Username(s) Share(s) Events Failed Auth Successful Auth Assessment
🟢/🟡/🔴 … … … … … … … …
Rank clients by potential risk.
Error Analysis
Create a table of the most frequent errors:
Rank Error / Status Count First Seen Last Seen Main Client(s) Likely Cause Severity
For each important NT_STATUS_* error, explain what it normally means in Samba and whether the observed context is concerning.
Authentication Analysis
Determine:
total authentication failures
total successful authentications, if available
most frequently failing usernames
most frequently failing IP addresses
users with unusual authentication patterns
IPs generating repeated failures
whether the pattern resembles brute force, misconfiguration, expired credentials, or normal user error
Do not claim an attack unless the log evidence supports that conclusion. Clearly distinguish evidence, interpretation, and hypothesis.
Share Analysis
Identify:
most accessed shares
shares generating errors
shares associated with authentication failures
shares associated with permission problems
unusual or potentially sensitive access patterns
Timeline
Create a concise chronological timeline of important events:
Time Severity Client/IP User Share Event Interpretation
Focus on meaningful events rather than repeating every normal log line.
Root-Cause Assessment
For the top 3–5 problems, provide:
Problem → Evidence → Probable Root Cause → Confidence → Recommended Fix
Use confidence levels:
High
Medium
Low
Never invent information that is not present in the log.
Recommended Actions
Separate recommendations into:
Immediate
Actions that should be taken now.
Short Term
Actions to investigate or implement within days.
Long Term
Hardening, monitoring, configuration, or architectural improvements.
Where appropriate, provide exact Linux/Samba commands or configuration examples, but clearly label commands that could modify the system.
Important Analysis Rules
Analyse the entire supplied log, not just the first or last section.
Quantify findings wherever possible.
Deduplicate repeated log messages when calculating root causes.
Preserve exact timestamps, IP addresses, usernames, share names, and error codes from the log.
Do not invent missing hostnames, users, IPs, or events.
Do not interpret every authentication failure as malicious.
Consider normal causes such as incorrect passwords, stale credentials, disconnected clients, Windows reconnect behaviour, permissions, and network interruptions.
Flag uncertainty explicitly.
If the log is incomplete, truncated, rotated, or appears to cover only part of the relevant period, state this.
If additional logs would be required (for example log.nmbd, log.winbindd, Samba audit logs, journalctl, Windows Event Logs, firewall logs, or authentication logs), identify exactly which ones and why.
Do not expose passwords, authentication tokens, or other secrets if they appear in the log. Redact them as [REDACTED].
Executive Summary
Finish with a short executive summary containing:
Overall Status: 🟢 / 🟡 / 🔴
Security: 🟢 / 🟡 / 🔴
Authentication: 🟢 / 🟡 / 🔴
Performance: 🟢 / 🟡 / 🔴
Reliability: 🟢 / 🟡 / 🔴
Configuration: 🟢 / 🟡 / 🔴
Then provide:
Top 5 findings
Top 5 recommended actions
Most suspicious IP/client, if any
Most problematic error
Overall risk assessment
Confidence in the assessment
Base the final rating on the evidence in the supplied log.smbd file and explain briefly why the overall status was chosen.
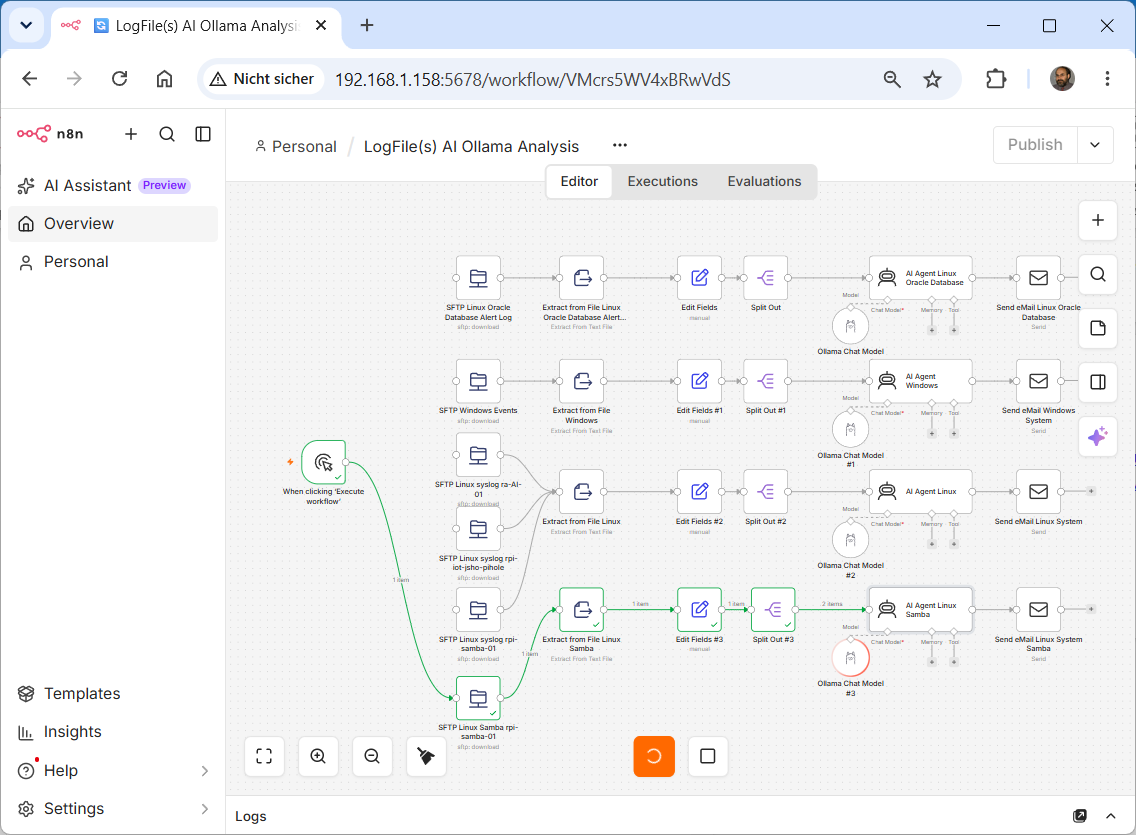
AI Workflow Automation N8N 2.36.8 – jetzt mit eigenständigen KI Agenten statt ’nur‘ Nodes
Freitag, August 28th, 2026AI Workflow Automation N8N 2.33.7 – how to use the ‚Split Out Node‘ to separate a single data item containing a list into multiple items because the model maximum context length is 65536 tokens
Montag, August 24th, 2026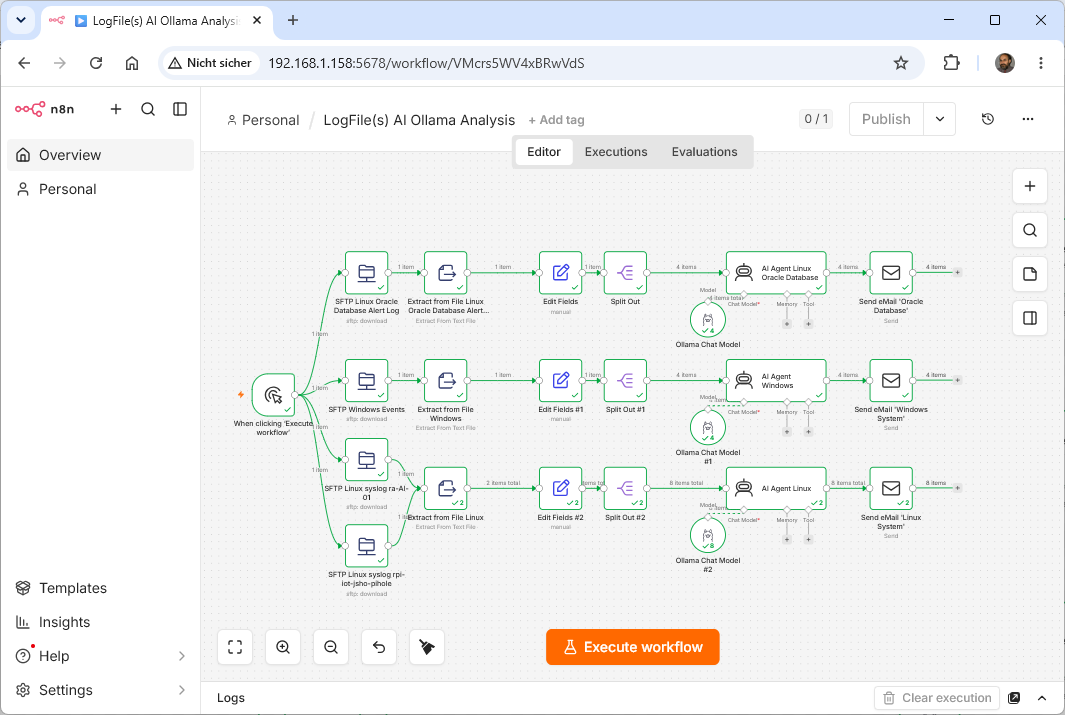


Freitag, August 21st, 2026
One command to self-host n8n, AI Assistant included: curl -fsSL https://t.co/1Zias3c8Io | sh
No compose file, no env vars. Add a model key and you're building workflows from plain words. Already self-hosting? Same command with –upgrade.
👉 Docs: https://t.co/A94vR1KXg8 pic.twitter.com/2MvRXw7dma— n8n.io (@n8n_io) August 21, 2026
AI Workflow Automation N8N – see how we changed agents
Mittwoch, August 19th, 2026AI Workflow Automation N8N 2.33.7 – new features and bug fixes
Sonntag, August 9th, 2026GEEKOM AI Mini PC IT13 Max – gebaut für einen lokalen KI Server der N8N Workflows Hermes Claude Code Kimi Ollama LM Studio und mehr verwaltet
Sonntag, August 2nd, 2026