Archive for the ‘Power BI’ Category
Microsoft Power BI – Monthly Update February 2024
Mittwoch, Februar 21st, 2024Microsoft Power BI – convert D:HH:MM:SS (text) to Days (dec)
Samstag, Februar 10th, 2024![]() One way to do this is to split the column by delimiter (colon in this case) to get separate columns for days hours minutes and seconds
One way to do this is to split the column by delimiter (colon in this case) to get separate columns for days hours minutes and seconds
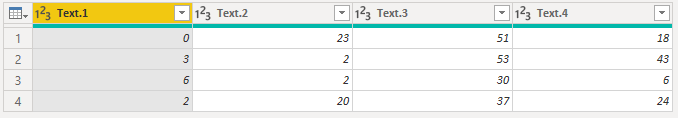
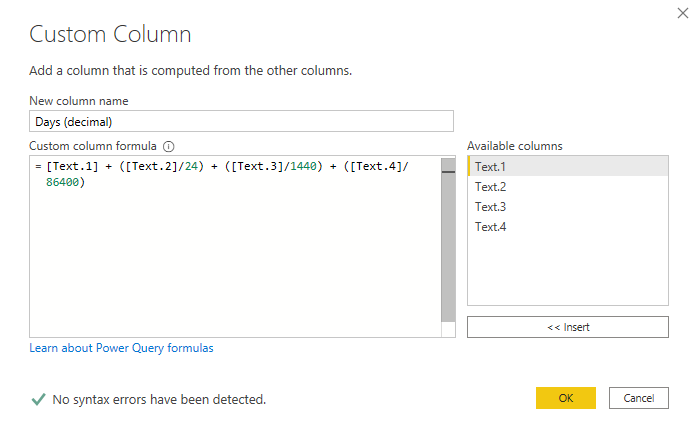
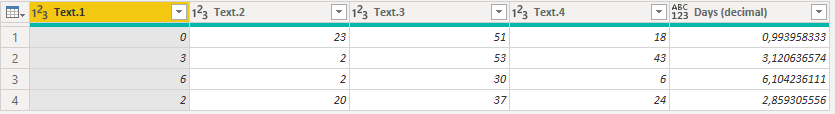
and then add a custom column using this formula
[Text.1] + ([Text.2]/24) + ([Text.3]/1440) + ([Text.4]/86400)
Microsoft Power BI – three hacks to work faster
Mittwoch, Januar 24th, 2024Microsoft Power BI – Data Visualization with Box Plots versus Violin Plots
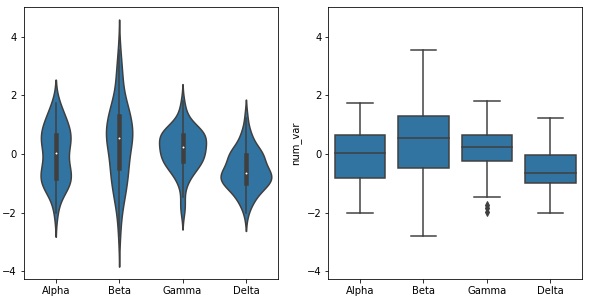
Sonntag, Dezember 17th, 2023![]() Comparing the two plots the box plot is a cleaner summary of the data than the violin plot it’s easier to compare statistics between the groups with a box plot this makes a box plot worth more consideration if you have a lot of groups to compare or if you are building explanatory plots you can clearly see from the box plot that the Delta group has the lowest median on the other hand the box plot lacks as nuanced a depiction of distributions as the violin plot you can’t see the slight bimodality present in the Alpha level values the violin plot may be a better option for exploration especially since seaborn’s implementation also includes the box plot by default
Comparing the two plots the box plot is a cleaner summary of the data than the violin plot it’s easier to compare statistics between the groups with a box plot this makes a box plot worth more consideration if you have a lot of groups to compare or if you are building explanatory plots you can clearly see from the box plot that the Delta group has the lowest median on the other hand the box plot lacks as nuanced a depiction of distributions as the violin plot you can’t see the slight bimodality present in the Alpha level values the violin plot may be a better option for exploration especially since seaborn’s implementation also includes the box plot by default