Archive for the ‘Power BI’ Category
Microsoft Power BI – to use the Sankey diagram visual to start visualizing flow data
Sonntag, August 12th, 2018Microsoft Power BI – for Health Plans Medicare Analysis
Samstag, August 11th, 2018Microsoft Power BI Desktop – Update August 2018
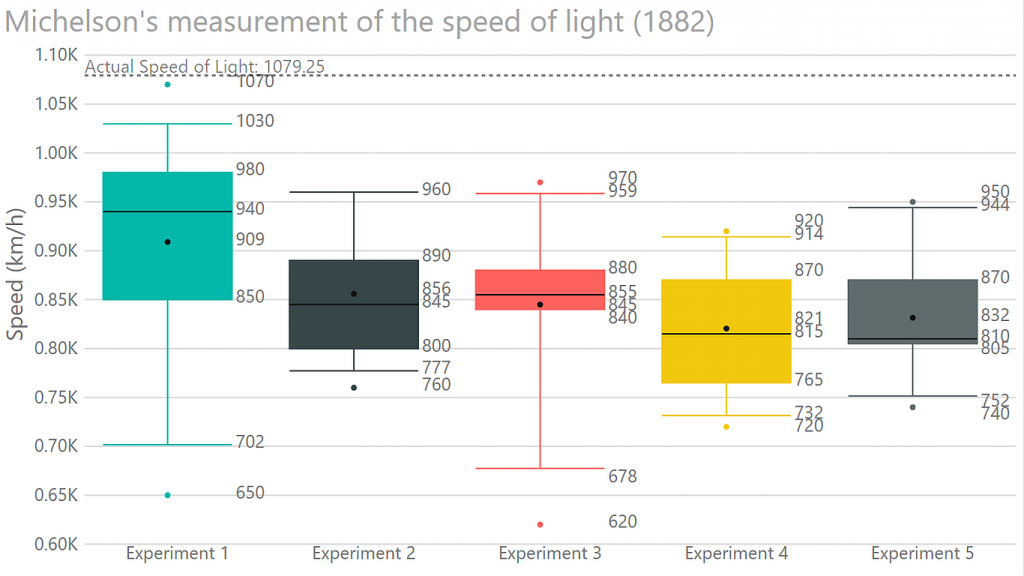
Donnerstag, August 9th, 2018Microsoft Power BI ‚Box and Whisker plot chart‘ – visualize a dataset in an effective way as a five-number summary (mean, median, quartiles, min/max)
Mittwoch, August 8th, 2018![]() Microsoft Power BI ‚Box and Whisker plot chart‘ – is a convenient way of graphically depicting groups of numerical data through their quartiles
Microsoft Power BI ‚Box and Whisker plot chart‘ – is a convenient way of graphically depicting groups of numerical data through their quartiles