Archive for the ‘Microsoft Solution’ Category
Microsoft Power BI – how to create a 3D representation of a scatter plot that you can even rotate via a slicer selection because visuals allow for a lot of flexibility over the built-in visuals while requiring just a little bit of code
Dienstag, August 21st, 2018Microsoft Power BI – nested if statements
Dienstag, August 21st, 2018Microsoft Power BI – can screen scrape data off websites
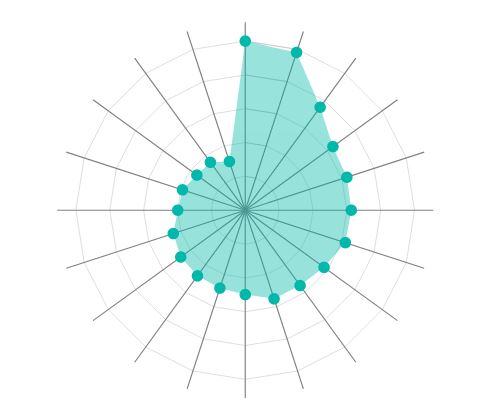
Dienstag, August 21st, 2018Microsoft Power BI ‚Radar Chart‘ – is useful for seeing which variables are scoring high or low within a dataset
Sonntag, August 19th, 2018![]() Microsoft Power BI ‚Radar Chart‘ – is a graphical method of displaying multivariate data in the form of a two-dimensional chart of three or more quantitative variables represented on axes starting from the same Point
Microsoft Power BI ‚Radar Chart‘ – is a graphical method of displaying multivariate data in the form of a two-dimensional chart of three or more quantitative variables represented on axes starting from the same Point
Microsoft Power BI – custom visuals gallery
Sonntag, August 19th, 2018![]() Microsoft Power BI – custom visuals gallery
Microsoft Power BI – custom visuals gallery
Microsoft Power BI Desktop – das Menü ‚Abfragen beantworten‘ mit ‚Datenquelleneinstellungen‘
Samstag, August 18th, 2018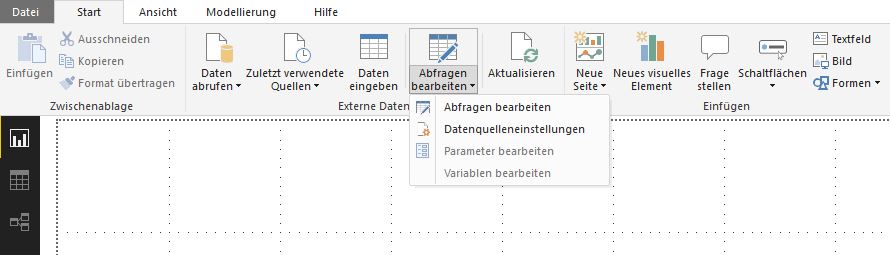
Microsoft Office Excel – Widerstände mit vier und fünf Farbringen zur Durchsteckmontage werden für viele Bastelprojekte rund um Rasperry Pi oder Arduino benötigt
Freitag, August 17th, 2018Microsoft Power BI – building a KPI scorecard
Donnerstag, August 16th, 2018Microsoft Office Excel – 3D-Karten & Heatmaps
Donnerstag, August 16th, 2018Microsoft Power BI – Visio Visual for Power BI is now generally available
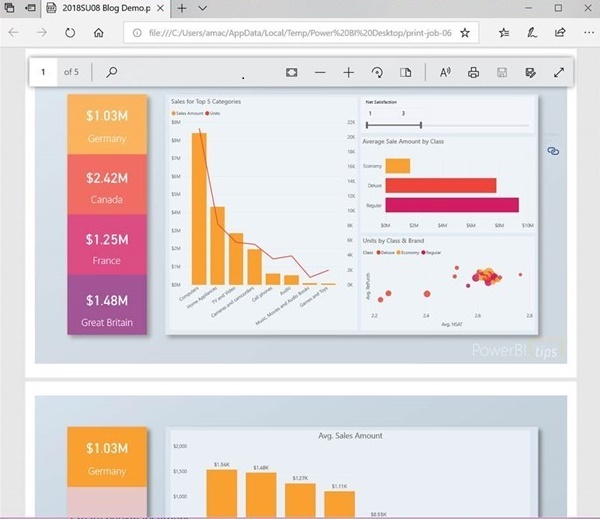
Sonntag, August 12th, 2018Microsoft Power BI Desktop – now allows you to export all visible report pages to PDF
Sonntag, August 12th, 2018