Archive for the ‘Microsoft Solution’ Category
Microsoft Power BI – to learn from historical data and predict future values
Freitag, August 31st, 2018Microsoft Office 365 – Starting October 2, subscribers can install Office 365 on an unlimited number of devices and be signed into their accounts on up to five of those devices at the same time
Freitag, August 31st, 2018
Microsoft Power BI – to PowerPoint & Excel
Freitag, August 31st, 2018Microsoft Power BI Desktop – Smart Filter
Donnerstag, August 30th, 2018Microsoft Power BI Desktop – Text Filter
Mittwoch, August 29th, 2018Microsoft Power BI – can now be widely deployed through the Microsoft Windows Store and brings you automatic updates and does not require administrator privileges for installation
Dienstag, August 28th, 2018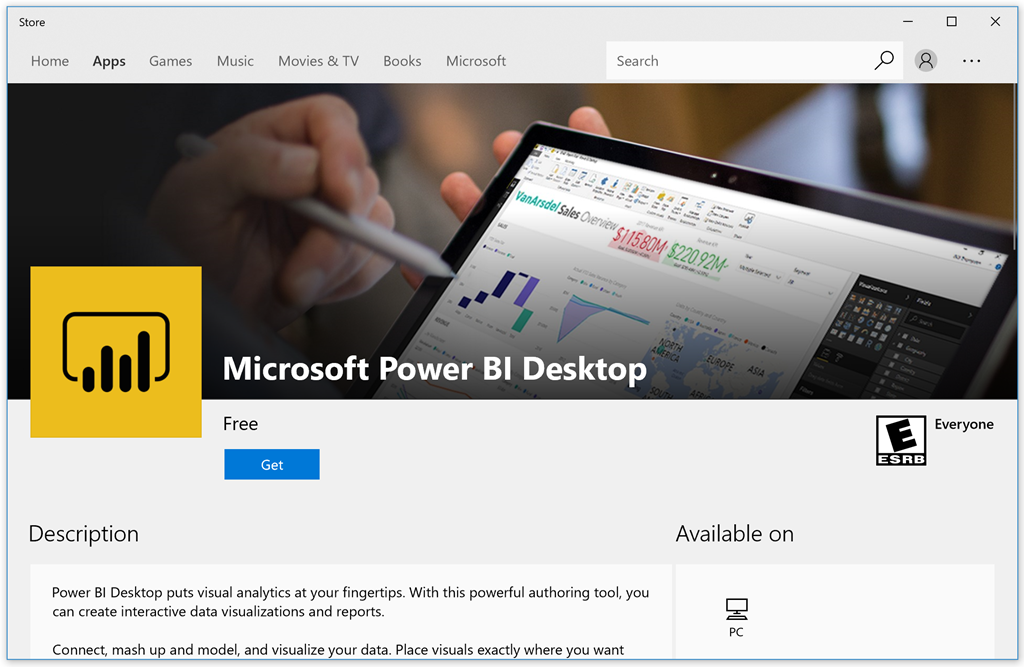
Microsoft Power BI – many-to-many relationships are now natively supported
Montag, August 27th, 2018Microsoft Surface Go – ab morgen steht das bislang kompakteste und leichteste Surface Tablet in Deutschland ab € 449 zum Verkauf
Montag, August 27th, 2018
Microsoft Power BI – running Python scripts
Samstag, August 25th, 2018Krankenhaus GmbH Weilheim-Schongau – immer mehr Kinder kommen im Schongauer Krankenhaus zur Welt im ganzen Jahr sind es schon 358
Samstag, August 25th, 2018Microsoft Power BI – create quick PowerPoint presentations
Samstag, August 25th, 2018Microsoft Power BI – date slicers make it really convenient to select time periods
Freitag, August 24th, 2018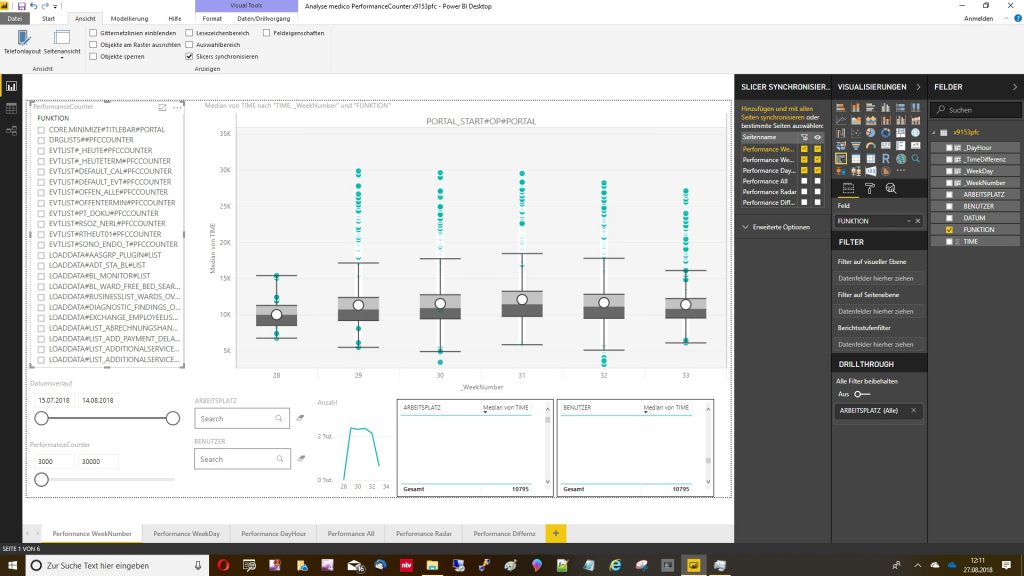
Microsoft Power BI – Scatter Chart by Akvelon
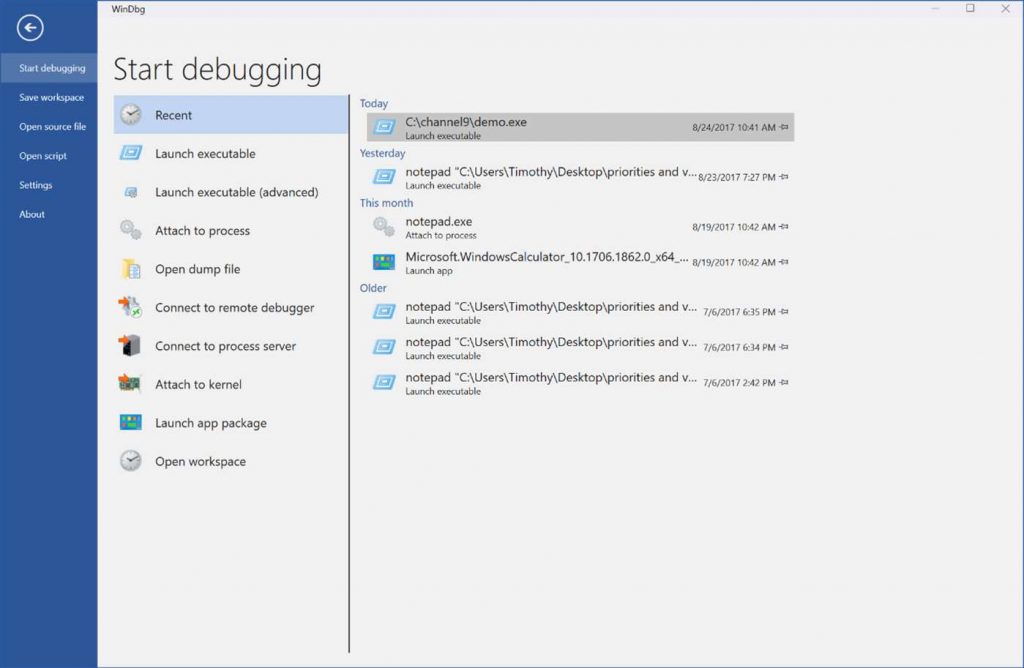
Freitag, August 24th, 2018Microsoft Windows Debugger (WinDbg) – can be used to debug kernel and user mode code, analyze crash dumps and to examine the CPU registers as code executes
Donnerstag, August 23rd, 2018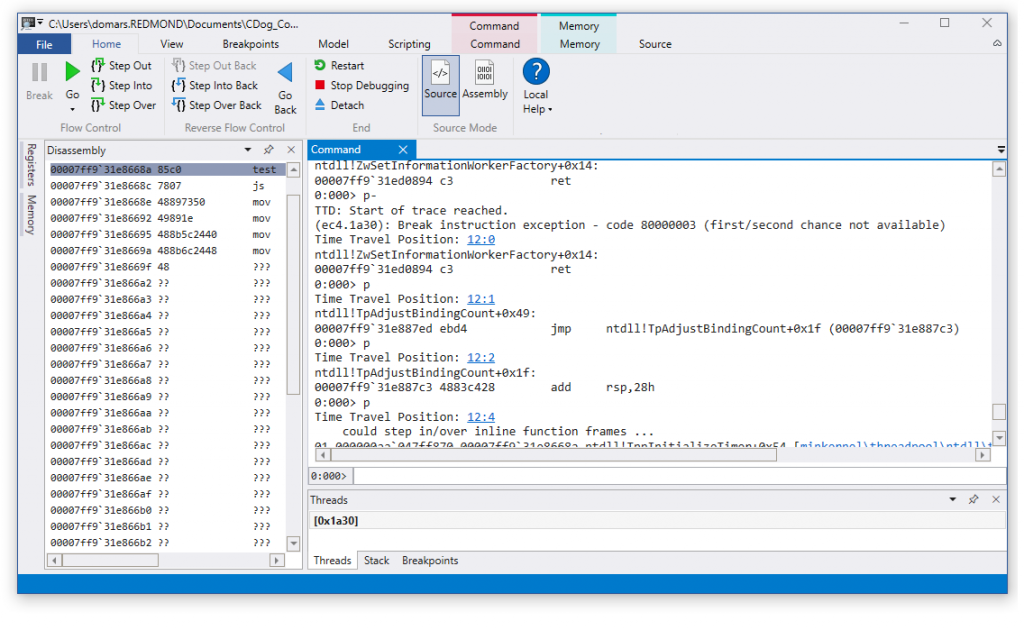
Microsoft Power BI – Inter Quartile Range (IQR)
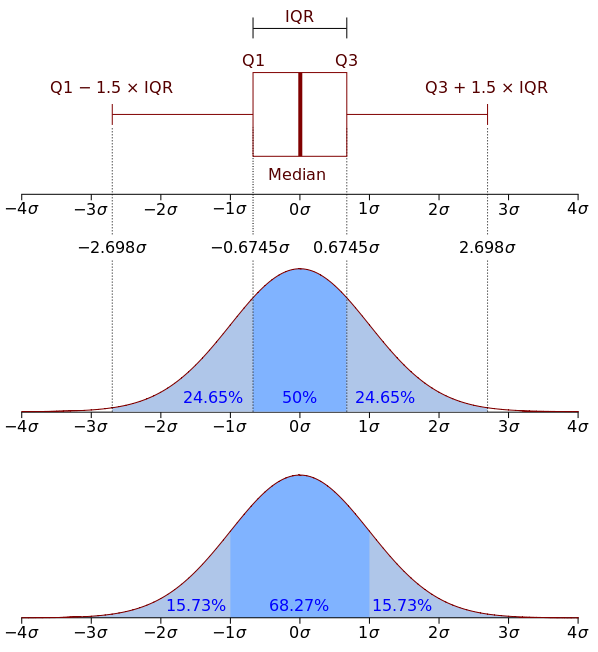
Mittwoch, August 22nd, 2018![]() Inter Quartile Range (IQR) – also called the midspread or middle 50% or technically H-spread is a measure of statistical dispersion being equal to the difference between 75th and 25th percentiles or between upper and lower quartiles IQR = Q3 − Q1. In other words the IQR is the first quartile subtracted from the third quartile these quartiles can be clearly seen on a box plot on the data it is a trimmed estimator defined as the 25% trimmed range and is the most significant basic robust measure of scale
Inter Quartile Range (IQR) – also called the midspread or middle 50% or technically H-spread is a measure of statistical dispersion being equal to the difference between 75th and 25th percentiles or between upper and lower quartiles IQR = Q3 − Q1. In other words the IQR is the first quartile subtracted from the third quartile these quartiles can be clearly seen on a box plot on the data it is a trimmed estimator defined as the 25% trimmed range and is the most significant basic robust measure of scale