Archive for the ‘Power BI’ Category
Microsoft Power BI – running Python scripts
Samstag, August 25th, 2018Krankenhaus GmbH Weilheim-Schongau – immer mehr Kinder kommen im Schongauer Krankenhaus zur Welt im ganzen Jahr sind es schon 358
Samstag, August 25th, 2018Microsoft Power BI – create quick PowerPoint presentations
Samstag, August 25th, 2018Microsoft Power BI – date slicers make it really convenient to select time periods
Freitag, August 24th, 2018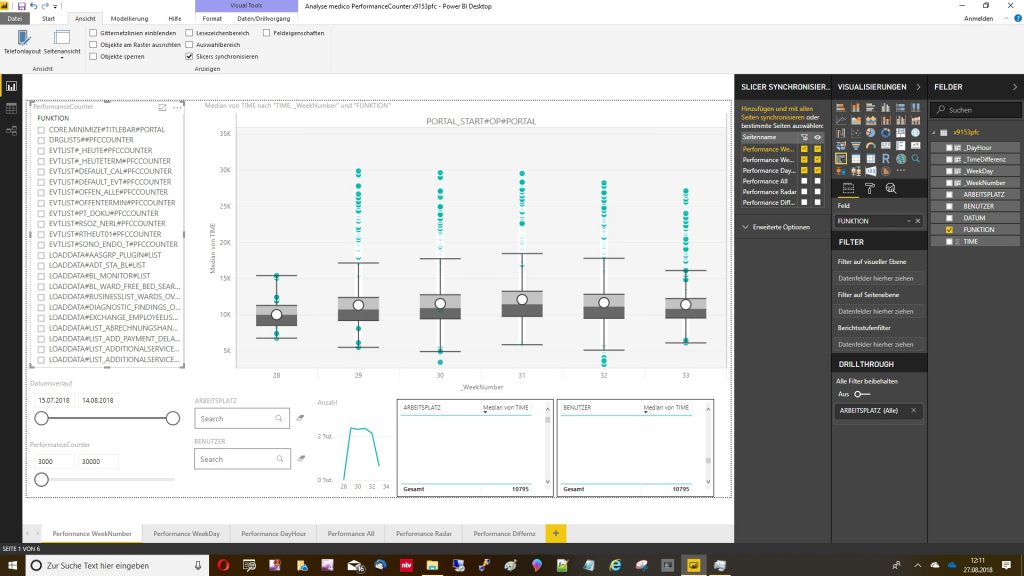
Microsoft Power BI – Scatter Chart by Akvelon
Freitag, August 24th, 2018Microsoft Power BI – Inter Quartile Range (IQR)
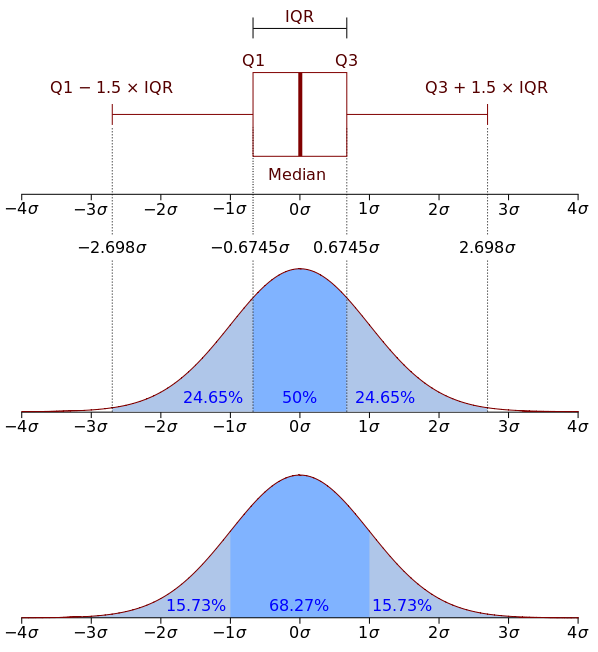
Mittwoch, August 22nd, 2018![]() Inter Quartile Range (IQR) – also called the midspread or middle 50% or technically H-spread is a measure of statistical dispersion being equal to the difference between 75th and 25th percentiles or between upper and lower quartiles IQR = Q3 − Q1. In other words the IQR is the first quartile subtracted from the third quartile these quartiles can be clearly seen on a box plot on the data it is a trimmed estimator defined as the 25% trimmed range and is the most significant basic robust measure of scale
Inter Quartile Range (IQR) – also called the midspread or middle 50% or technically H-spread is a measure of statistical dispersion being equal to the difference between 75th and 25th percentiles or between upper and lower quartiles IQR = Q3 − Q1. In other words the IQR is the first quartile subtracted from the third quartile these quartiles can be clearly seen on a box plot on the data it is a trimmed estimator defined as the 25% trimmed range and is the most significant basic robust measure of scale
Microsoft Power BI – how to create a 3D representation of a scatter plot that you can even rotate via a slicer selection because visuals allow for a lot of flexibility over the built-in visuals while requiring just a little bit of code
Dienstag, August 21st, 2018Microsoft Power BI – nested if statements
Dienstag, August 21st, 2018Microsoft Power BI – can screen scrape data off websites
Dienstag, August 21st, 2018Microsoft Power BI ‚Radar Chart‘ – is useful for seeing which variables are scoring high or low within a dataset
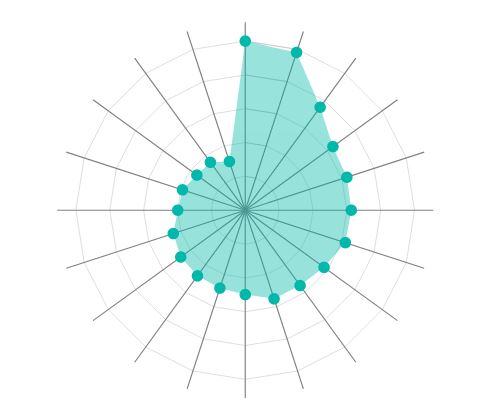
Sonntag, August 19th, 2018![]() Microsoft Power BI ‚Radar Chart‘ – is a graphical method of displaying multivariate data in the form of a two-dimensional chart of three or more quantitative variables represented on axes starting from the same Point
Microsoft Power BI ‚Radar Chart‘ – is a graphical method of displaying multivariate data in the form of a two-dimensional chart of three or more quantitative variables represented on axes starting from the same Point
Microsoft Power BI – custom visuals gallery
Sonntag, August 19th, 2018![]() Microsoft Power BI – custom visuals gallery
Microsoft Power BI – custom visuals gallery
Microsoft Power BI Desktop – das Menü ‚Abfragen beantworten‘ mit ‚Datenquelleneinstellungen‘
Samstag, August 18th, 2018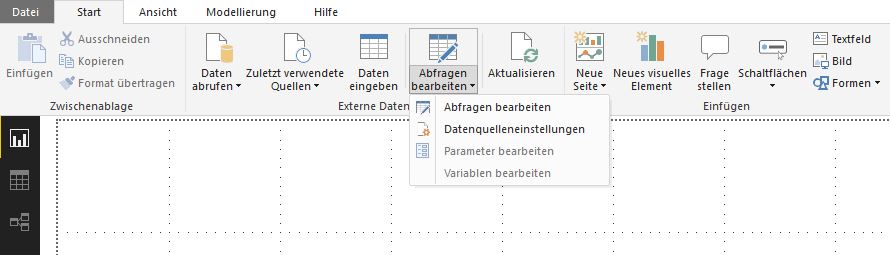
Microsoft Power BI – building a KPI scorecard
Donnerstag, August 16th, 2018Microsoft Power BI – Visio Visual for Power BI is now generally available
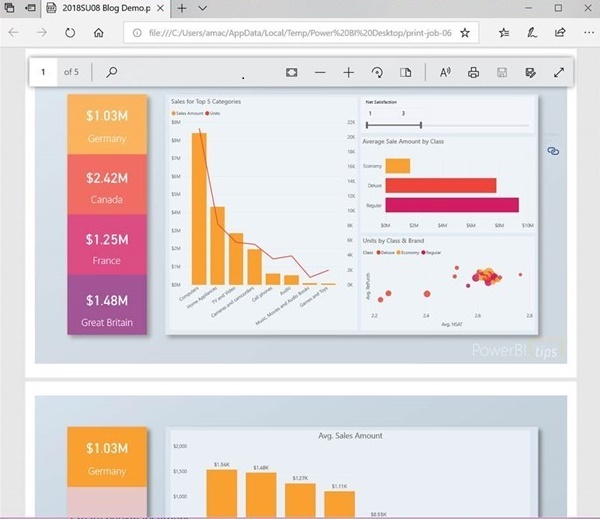
Sonntag, August 12th, 2018Microsoft Power BI Desktop – now allows you to export all visible report pages to PDF
Sonntag, August 12th, 2018