![]() Microsoft Defender Advanced Threat Protection (ATP) – using performance analyzer
Microsoft Defender Advanced Threat Protection (ATP) – using performance analyzer
A new set of PowerShell cmd-lets have been released which allows us to do a performance recording of defender New-MpPerformanceRecording and Get-MpPerformanceReport and troubleshooting performance
When showing the help of the cmd-let we can see that there are two parameters
-RecordTo <string>: The path of the outputfile
-Seconds <int>: Number of seconds to run the recording
The seconds parameter is useful when running none-interactive sessions against multiple devices
PS C:\tmp> New-MpPerformanceRecording -RecordTo .\recording.etl
Found 10.0.22621.1635 at C:\WINDOWS\system32\wpr.exe
Using C:\WINDOWS\system32\wpr.exe version 10.0.22621.1635 (WinBuild.160101.0800)
Starting Microsoft Defender Antivirus performance recording… ok.
Recording has started.
=> Reproduce the scenario that is impacting the performance on your device.
Press <ENTER> to stop and save recording or <Ctrl-C> to cancel recording:
Stopping Microsoft Defender Antivirus performance recording…
Press Ctrl+C to cancel the stop operation.
100% [>>>>>>>>>>>>>>>>>>>>>>>>>>>>>>>>>>>>>>>>>>>>>>>>>>>>>>>>>>>>]
The trace was successfully saved.
ok.
Recording has been saved to ‚C:\tmp\recording.etl‘.
The performance analyzer provides insight into problematic files that could
cause performance degradation of Microsoft Defender Antivirus. This tool is
provided „AS IS“, and is not intended to provide suggestions on exclusions.
Exclusions can reduce the level of protection on your endpoints. Exclusions,
if any, should be defined with caution.
The trace you have just captured may contain personally identifiable information,
including but not necessarily limited to paths to files accessed, paths to
registry accessed and process names. Exact information depends on the events that
were logged. Please be aware of this when sharing this trace with other people.
PS C:\tmp>
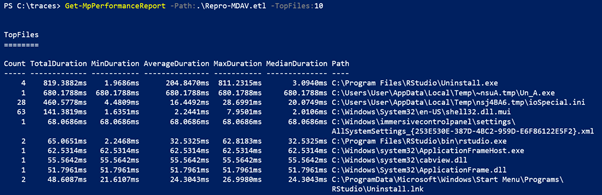
The cmd-let allows us to look at the data in different ways
-TopFiles
-TopScansPerFile
-TopProcessesPerFile
-TopScansPerProcessPerFile
-TopExtensions
-TopScansPerExtension
-TopFilesPerExtension
-TopScansPerProcess
PS C:\tmp> Get-MpPerformanceReport -Path .\recording.etl -TopFiles 3 -TopScansPerFile 10
TopFiles
========
Count TotalDuration MinDuration AverageDuration MaxDuration MedianDuration Path
—– ————- ———– ————— ———– ————– —-
3 105,1521ms 27,4543ms 35,0507ms 49,6214ms 28,0764ms C:\ProgramData\McAfee\WebAdvisor\UIManager.d
ll\log_000B005C00210011000E.txt
Scans:
ScanType Duration Reason SkipReason ProcessName Path
——– ——– —— ———- ———– —-
RealTimeScan 49,6214ms OnClose Not skipped uihost.exe (8028)
C:\ProgramData\McAfee\WebAdvisor\UIManager.dll\log_000B…
RealTimeScan 28,0764ms OnClose Not skipped uihost.exe (8028)
C:\ProgramData\McAfee\WebAdvisor\UIManager.dll\log_000B…
RealTimeScan 27,4543ms OnClose Not skipped uihost.exe (8028)
C:\ProgramData\McAfee\WebAdvisor\UIManager.dll\log_000B…
Count TotalDuration MinDuration AverageDuration MaxDuration MedianDuration Path
—– ————- ———– ————— ———– ————– —-
1 70,1018ms 70,1018ms 70,1018ms 70,1018ms 70,1018ms C:\Windows\System32\sendmail.dll
Scans:
ScanType Duration Reason SkipReason ProcessName Path
——– ——– —— ———- ———– —-
RealTimeScan 70,1018ms OnOpen Not skipped explorer.exe (5232) C:\Windows\System32\sendmail.dll
Count TotalDuration MinDuration AverageDuration MaxDuration MedianDuration Path
—– ————- ———– ————— ———– ————– —-
1 68,2711ms 68,2711ms 68,2711ms 68,2711ms 68,2711ms C:\Windows\System32\fsquirt.exe
Scans:
ScanType Duration Reason SkipReason ProcessName Path
——– ——– —— ———- ———– —-
RealTimeScan 68,2711ms OnOpen Not skipped explorer.exe (5232) C:\Windows\System32\fsquirt.exe
PS C:\tmp>
PS C:\tmp> (Get-MpPerformanceReport -Path .\recording.etl -Topscans 1000).TopScans | ConvertTo-Json -Depth 1